Example of a Definitive Screening Design
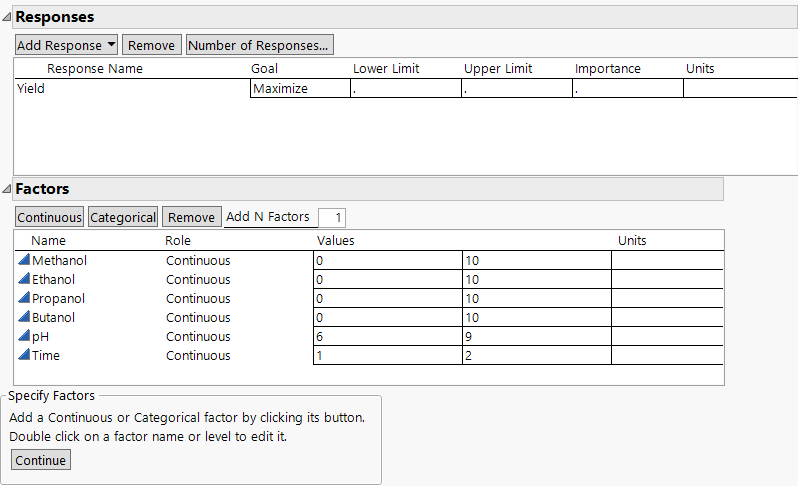
This example uses a definitive screening design to explore which of six factors have an effect on the yield of an extraction process.The factors and their settings are given in the data table Extraction Factors.jmp. You create a definitive screening design to investigate.
1. Select DOE > Definitive Screening > Definitive Screening Design.
2. Double-click Y under Response Name and type Yield.
3. Select Help > Sample Data Folder and open Design Experiment/Extraction Factors.jmp.
4. Click the red triangle next to Definitive Screening Design and select Load Factors
The factor names and ranges are added to the Factors section.
Figure 8.2 Responses and Factors for Extraction Design
5. Click Continue.
The Design Options section opens. Here you can specify a blocking structure. There is no need to block in this example, so you accept the default selection of No Blocks Required.
You can also choose to add Extra Runs, which greatly enhance your ability to detect second-order effects. A minimum of four Extra Runs is highly recommended and is the default.
6. Click Make Design.
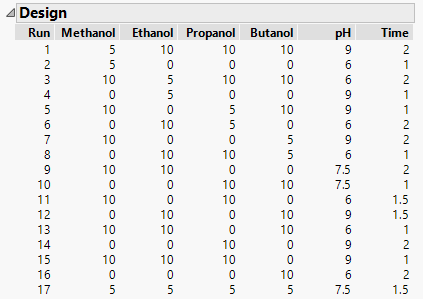
The Definitive Screening Design window updates to show a Design section and a Design Evaluation section.
Figure 8.3 Design
7. Open the Design Evaluation > Color Map on Correlations section.
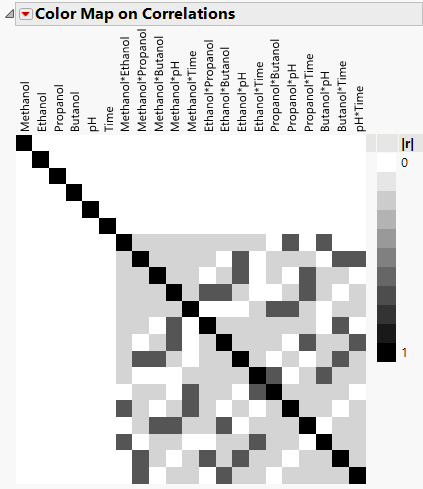
The Color Map on Correlations assigns a color intensity scale to the absolute values of correlations among all main effects and two-factor interactions.
Figure 8.4 Color Map on Correlations for Extraction Design
Note the following:
– The solid white area shows that there is no correlation between main effects or between main effects and two-factor interactions.
– The shaded gray areas indicate that the absolute correlations between two-factor interactions are small.
– The black squares indicate absolute correlations of 1. These all appear on the diagonal, reflecting the expected correlation of an effect with itself.
In the Output Options panel, note that the Run Order is set to Randomize.
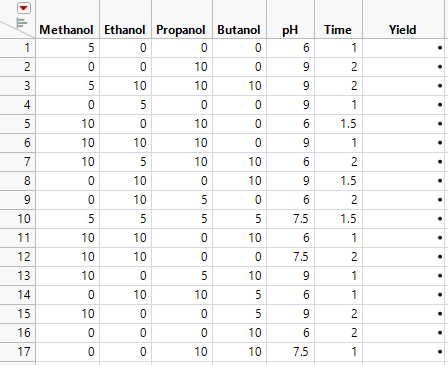
8. Click Make Table to obtain the data table shown in Figure 8.5.
Note: The runs in your design might appear in a different order than the order shown in Figure 8.5.
Figure 8.5 Definitive Screening Design for Extraction Process


