Example of an LS Means Plot
Use the Standard Least Squares personality of the Fit Model platform to fit a linear regression model. You are interested in viewing a least squares means plot to investigate the effect of batch on the yield of popcorn.
1. Select Help > Sample Data Folder and open Popcorn.jmp.
2. Select Analyze > Fit Model.
3. Select yield and click Y.
4. Select popcorn, oil amt, and batch and click Macros > Full Factorial. Note that the Emphasis changes to Effect Screening.
5. Click Run.
6. Click the Effect Details disclosure icon to show the details for the seven model effects.
7. Click the batch red triangle and select LSMeans Plot.
8. Click the popcorn*batch red triangle and select LSMeans Plot. The Least Squares Means Plot Options window appears.
9. In the Least Squares Means Plot Options window, click the box next to Create an Interaction Plot.
10. Under Choose Terms for Overlay, select popcorn.
11. Click OK.
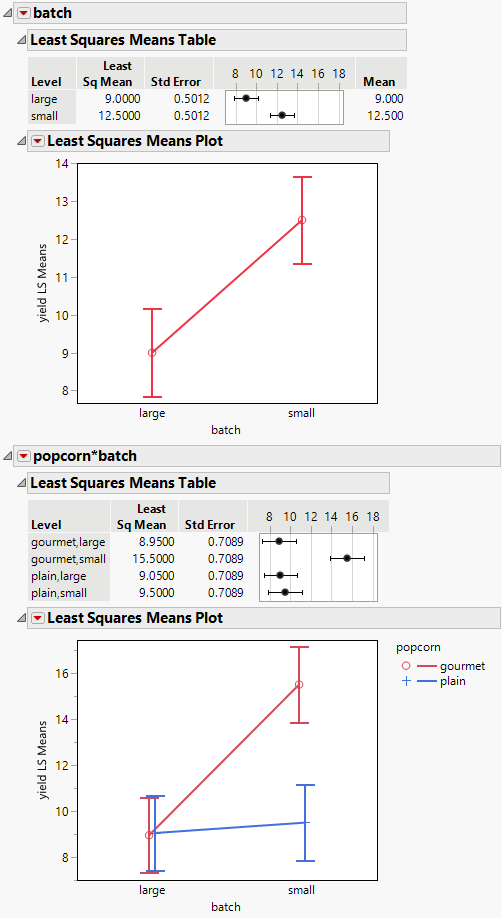
Figure 4.41 Least Squares Means Tables and Plots for Two Effects
In the batch least squares mean plot, notice that the yield for small batches is greater than for large batches. In the interaction plot, notice that there is a difference in the yield of small batches that depends on the type of popcorn. Gourmet popcorn has the greatest yield when popped in small batches.
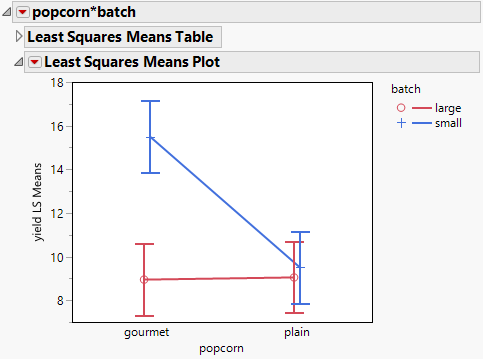
12. To transpose the factors in the plot for popcorn*batch, repeat step 8 and step 9.
13. Under the Choose Terms for Overlay, select batch and click OK.
Figure 4.42 LSMeans Plot for Interaction with Factors Transposed
This interaction plot depicts the same information. Depending on your interest, one might be more intuitive than the other.

