Example of Capturing a JMP Workflow
This example builds the WorkflowBuilder.jmpflow found in the Sample Workflow folder. The workflow does the following:
• Oopens a data table
• Pprepares the data by adding a new formula column, changing a column name, and formatting values
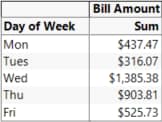
• Bbuilds a table showing bill amounts by server by day of the week
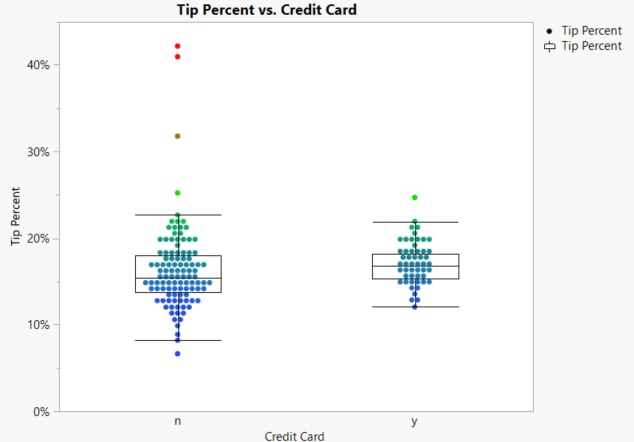
• Bbuilds a graph showing tip percentages by credit card type
To open the sample workflow select Help > Sample Index, click the Sample Index red triangle and select Open Sample > Workflow. Open WorkflowBuilder.jmpflow. To build the workflow follow the steps below.
Start Recording and Open Data
1. Select File > New > Workflow (Windows) or File > New > New Workflow (macOS).
2. Click ![]() to start recording your actions.
to start recording your actions.
Tip: This example starts recording before performing any steps. However, you can capture steps after you have performed them. See JMP Log History.
3. Select Help > Sample Data Folder and open Restaurant Tips.jmp.
Notice that a step to open the data table is recorded in the Workflow Steps.
Prepare Data
To illustrate data preparation steps, create a new Tip Percent column.
1. Highlight the Bill Amount and the Tip Amount columns, right-click on the column headings and select New Formula Column > Combine > Ratio (reverse order).
2. Format the new formula column that you added to the table:
a. Highlight the Tip Amount/Bill Amount column and select Cols > Column Info.
b. Change the Column Name to Tip Percent.
c. Select Percent From the Format drop-down menu and set the number of decimals to 1.
d. Click OK.
Build a Table
1. Click Analyze >Tabulate.
Note: A step named Launch platform: Tabulate is added to the workflow.
2. Drag Day of Week to the Drop zone for rows.
3. Drag Bill Amount into the values under N.
4. Click Done.
Figure 7.12 Table of Bill Amounts by Day
5. To confirm that the analysis is complete, close the Tabulate window.
Note: The step named Launch platform: Tabulate is replaced with a Report snapshot step.
Tip: If you were not actively recording your steps, use Save Script > To Workflow from the platform’s red triangle menu to add the step to the Workflow Builder.
Build a Graph
1. Click Graph > Graph Builder.
Note: A step named Launch platform: Graph Builder is added to the workflow.
2. Drag Credit Card to the X axis.
3. Drag Tip Percent to the Y axis.
4. Hold the shift key and click the Box Plot element ![]() .
.
5. Click Done.
Figure 7.13 Graph Builder For Tip Percentage by Credit Card Type
6. To confirm that the graph is complete, close the Graph Builder window.
Note: The step named Launch platform: Graph Builder is replaced with a Report snapshot step.
Stop Recording and Test the Workflow
1. Click ![]() to stop recording.
to stop recording.
2. (Optional) Click the Workflow Builder red triangle and select Display Options > Presentation Mode.
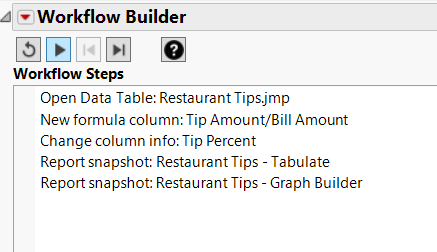
Figure 7.14 Workflow Builder in Presentation Mode
3. Click ![]() to reset. This closes any open windows and resets the workflow to the start.
to reset. This closes any open windows and resets the workflow to the start.
Note: The reset button closes only those windows opened by the workflow. The reset button does not close message windows.
4. Click ![]() to test the workflow.
to test the workflow.
Tip: You can perform these steps to test your workflow at any time. You can continue to edit the workflow after testing.
Save the Workflow
1. Click File > Save.
JMP Workflows have the extension .jmpflow.
Tip: To add steps to a saved workflow, open the workflow in JMP and simply start recording again. If the workflow is in presentation mode, deselect to make additional changes.
Share the Workflow
To share a workflow with another JMP user, create a workflow package. The package contains the workflow and associated files. The file is a *.jmpflowjmpflow file.
1. Click the Workflow Builder red triangle and select Export > Create Workflow Package.
2. Select Presentation Mode to have the workflow open with the Log History and step settings closed. Select Lock to prevent changes to the workflow.
3. Confirm the inclusion of the data sources. To send a copy of the associated data, keep the box selected.
If you do not include a copy of the data, anyone that you share the workflow with is prompted to open a data table. The data table must be compatible with the workflow, otherwise the user could encounter errors.
Note: When data is on a shared drive, it might not be necessary to include the data sources in your workflow package.
4. Click OK.
On your computer, navigate to where you saved the workflow package. You can send this package to any JMP user.
There is a lot more you can do with workflows, such as add popup windows, hide data tables from analyses, and change the text of workflow steps. For more details, see “Save a JMP Workflow” in Using JMP.


