Example of Measurement Error Models
Measurement error models in the Structural Equation Models platform can be used to analyze survey responses, especially if you suspect that there might be inaccuracies or biases in the responses. This example demonstrates how to analyze responses of a survey that was developed to measure key workplace constructs related to job satisfaction. The survey includes 11 questions that can be divided into three categories; leadership, conflict, and satisfaction. Responses to questions in each category are averaged to define the score for that specific category.
Suppose you are interested in understanding the relationship between leadership and conflict to overall job satisfaction. If you believe that responses to the survey questions are measured with error, a measurement error model that adjusts for these inaccuracies is appropriate. Such measurement errors could exist for various reasons. For example, respondents might overestimate or underestimate their job satisfaction. In addition, different respondents might interpret the survey questions differently, which could lead to systematic measurement errors in their responses. The survey questions themselves might also not perfectly capture the intended aspects of job satisfaction.
You know from prior studies that there is measurement error in both the predictors and the outcome. Assume that the estimates of reliable variance (Reliability) are 0.87 for Leadership_Avg, 0.76 for Conflict_Avg, and 0.82 for Satisfaction_Avg.
1. Select Help > Sample Data Folder and open Job Satisfaction.jmp.
2. Select Analyze > Multivariate Methods > Structural Equation Models.
3. Select Leadership_Avg, Conflict_Avg, and Satisfaction_Avg and click Model Variables.
4. Click OK.
5. Click the Model Shortcuts red triangle and select Specification Assist > Fix Measurement Error.
6. In the Account for Measurement Error in Observed Variables window, select Leadership_Avg, Conflict_Avg, and Satisfaction_Avg.
7. Select Reliability (0-1) as the estimate type and enter 0.87, 0.76, and 0.82 as the estimates for Leadership_Avg, Conflict_Avg, and Satisfaction_Avg, respectively.
Tip: You can change the default names of the latent variable names using the text edit boxes next to where the estimates are entered.
8. Click OK.
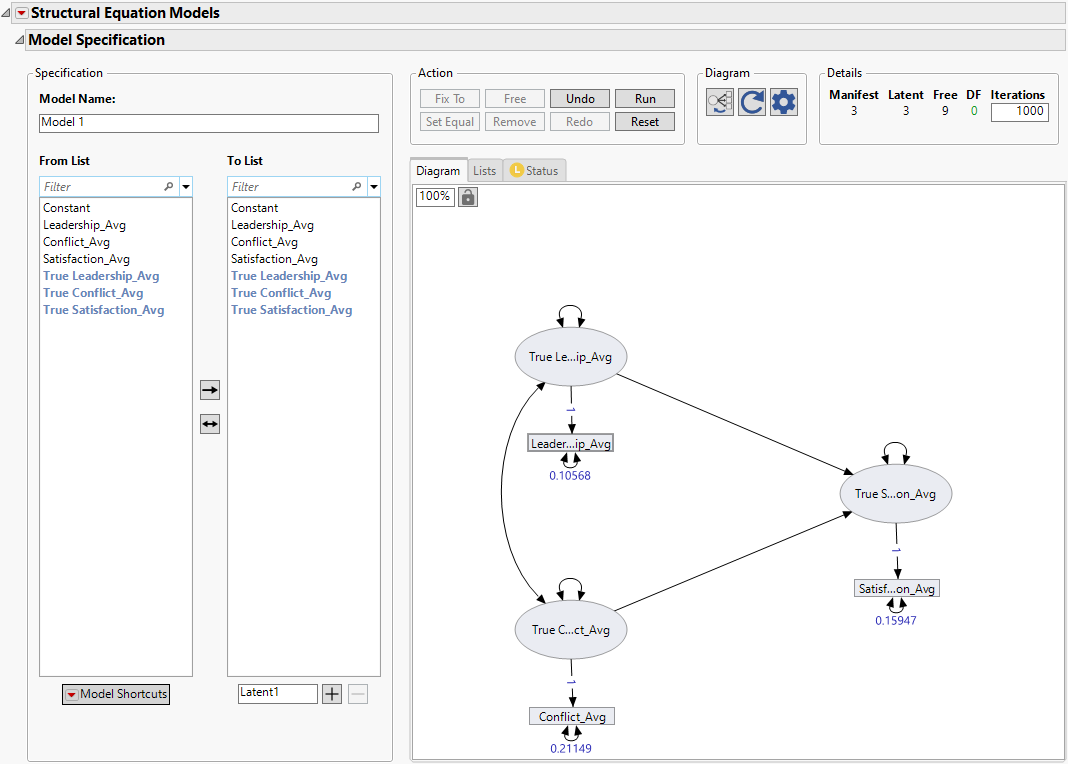
9. Select True Leadership_Avg and True Conflict_Avg in the From List, select True Satisfaction_Avg in the To List, and click the unidirectional arrow ![]() button.
button.
10. Select True Leadership_Avg in the From List, and True Conflict_Avg in the To List, and click the bidirectional arrow ![]() button to specify a covariance between the latent variables for Leadership_Avg and Conflict_Avg.
button to specify a covariance between the latent variables for Leadership_Avg and Conflict_Avg.
Figure 8.17 Measurement Error Model Specification
11. In the Action section, click Run.
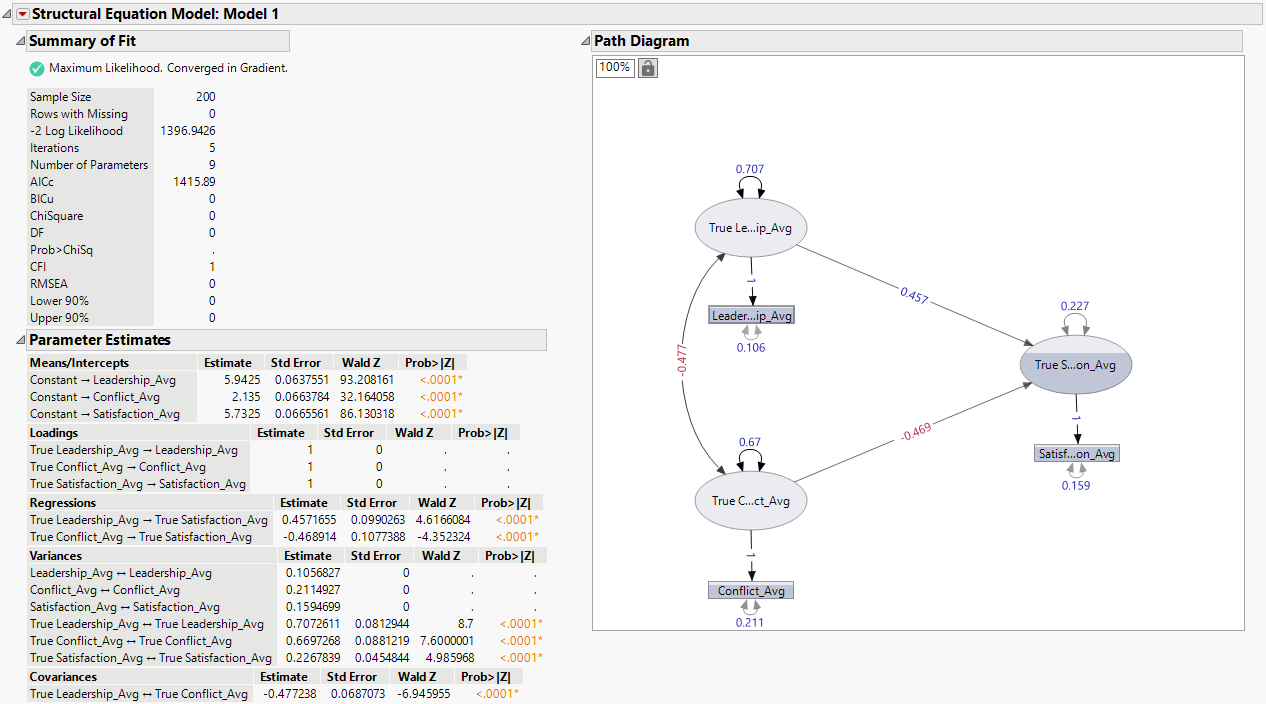
Figure 8.18 Measurement Error Model Report
The Structural Equation Model report includes Summary of Fit and Parameter Estimates tables, as well as a path diagram representation of the fitted model. From the parameter estimates, you can conclude that the model contains significant effects between true dependent and independent variables (p-value < 0.0001). The parameter estimates for True Leadership_Avg and True Conflict_Avg are 0.457 and -0.469, respectively. The standard errors are 0.099 and 0.108 for True Leadership_Avg and True Conflict_Avg, respectively.
The path diagram also highlights the significant direct relationships between True Leadership_Avg and True Satisfaction_Avg, as well as between True Conflict_Avg and True Satisfaction_Avg. The covariance between True Leadership_Avg and True Conflict_Avg is also shown as -0.477. The path diagram also shows estimates of the measurement error variances, converted from the reliability estimates (0.87, 0.76, and 0.82) that were specified in the Account for Measurement Error in Observed Variables window. These numerical equivalents of the estimated variances are shown as 0.106 for Leadership_Avg, 0.211 for Conflict_Avg, and 0.159 for Satisfaction_Avg.
Compare Results to a Multiple Linear Regression Model
1. Select Analyze > Fit Model.
2. Select Satisfaction_Avg and click Y.
3. Select Leadership_Avg and Conflict_Avgand click Add.
4. Click Run.
Figure 8.19 Multiple Linear Regression Parameter Estimates
The estimates shown in Figure 8.19 are significant (p-value < 0.0001) for both predictors. When measurement errors are ignored and a multiple linear regression model is applied, the estimates are 0.467 and -0.351 for Leadership_Avg and Conflict_Avg, respectively. Note that these estimates differ from those calculated through measurement error models (0.457 and -0.469). Also, the standard error estimates for the predictors differ between models. The corresponding estimates in the measurement error model are 0.099 and 0.108 for True Leadership_Avg and True Conflict_Avg, whereas the same estimates are 0.064 and 0.061 for Leadership_Avg and Conflict_Avg when a multiple linear regression model is applied. By comparing the parameter estimates in Figure 8.18 and Figure 8.19, it is evident that both the estimates and their standard errors for the predictors differ when measurement errors are taken into account versus when they are ignored. Specifically, the standard error estimates of the predictors are higher when measurement errors are considered.


