Example of the Destructive Degradation Platform
In this example, you are interested in estimating the proportion of units that have a strength less than a threshold after certain stress conditions are applied. The data consist of measurements on the strength (measured in newtons) of an adhesive bond. Temperature is considered to be an acceleration factor. The product is stressed until the bond breaks and the required breaking stress is recorded. Because units at normal temperatures are unlikely to break, the units were tested at several levels over a wide range of temperatures. Strength less than 50 newtons is considered failure. You want to estimate the proportion of units with a strength below 50 newtons after 156 weeks (3 years) at a reference temperature of 35 degrees Celsius. This example of an accelerated destructive degradation model is patterned after an example from Escobar et al. (2003).
This example has three stages:
• Perform the Initial Analysis
• Change the Model and Generate the Report
• Use the Profilers for Prediction
Perform the Initial Analysis
1. Select Help > Sample Data Folder and open Reliability/Adhesive Bond.jmp.
2. Select Analyze > Reliability and Survival > Destructive Degradation.
3. Select Strength and click Y, Response.
4. Select Weeks and click Time.
5. Select Degrees and click X.
The temperature is the accelerating factor in the experiment.
6. Select Censor and click Censor.
Notice that the Censor Code is set to Right.
7. Click OK.
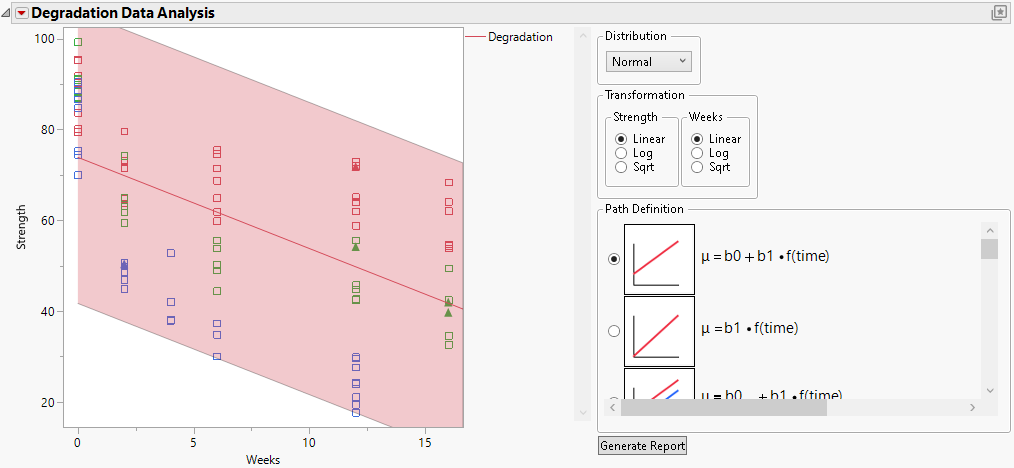
Figure 9.2 Initial Degradation Plot
The platform specifies a default model. The default model assumes that the data are described by a single Normal distribution, whose location parameter is a linear function of time.
Change the Model and Generate the Report
1. Select Log for the Y (Strength) Transformation.
2. Select Sqrt for the Time (Weeks) Transformation.
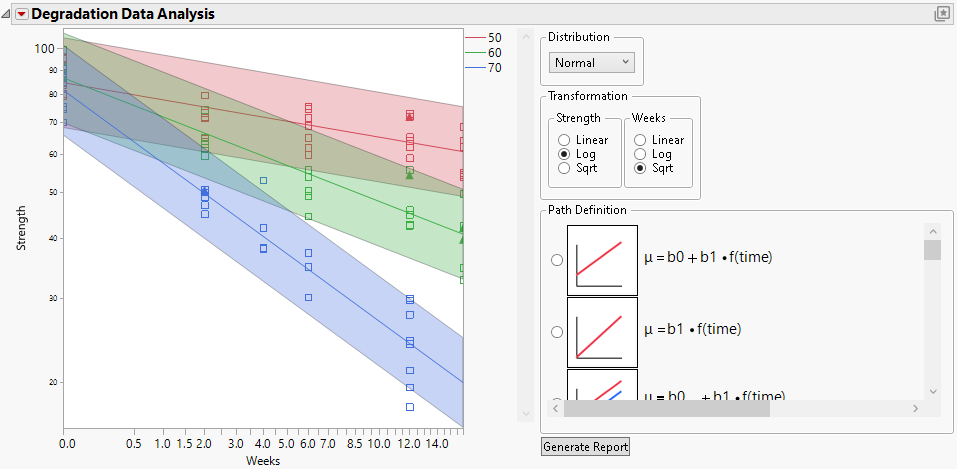
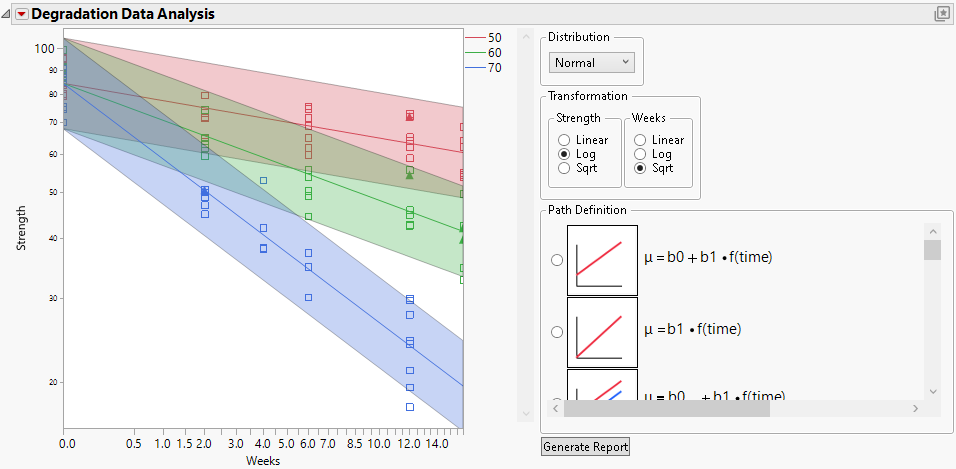
3. Select μ = b0x + b1x*f(time) for the Path Definition.
The subscript “x” denotes the accelerating variable, which is Degrees in this example.
Note: This model is linear in all parameters.
Figure 9.3 Plot Showing Model
4. Click Generate Report.
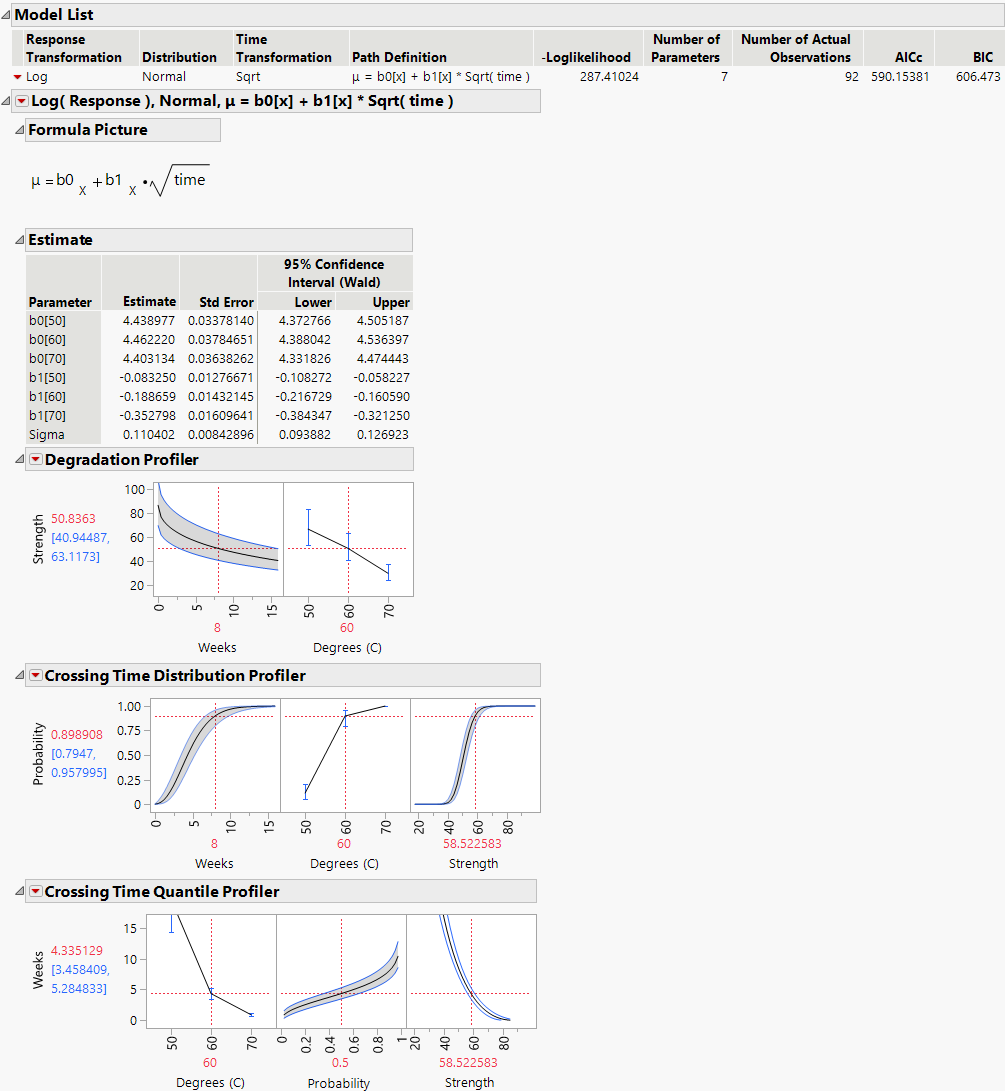
Figure 9.4 Report for Basic Model
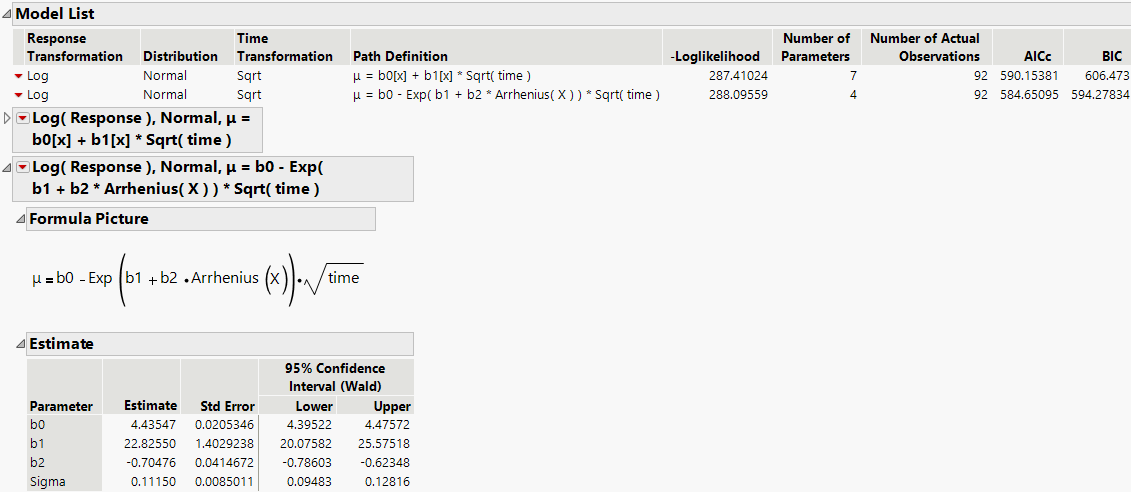
The estimates of the slope b1 at the three values of Degrees suggest that degradation occurs more quickly at higher temperatures. Failure mechanisms that depend on chemical processes are often well modeled using the Arrhenius model for temperature. For this reason, you now fit a model where an Arrhenius transformation is applied to Degrees, which is measured on a Celsius scale.
5. Select μ = b0 ± Exp(b1 + b2*Arrhenius(X))*f(time) for the Path Definition.
Note: This model is not linear in the parameters.
6. Select Celsius and click OK.
Figure 9.5 Plot Showing Model with Arrhenius Transformation
7. Click Generate Report.
Figure 9.6 Report Including Second Model with Arrhenius Transformation
Use the Profilers for Prediction
Because the Arrhenius model shows a better fit, as indicated by its smaller AICc and BIC values (Figure 9.6), you continue your analysis using this model.
Recall that strength less than 50 newtons is considered failure. You are interested in units lasting 156 weeks (three years) at a reference temperature of 35 degrees Celsius. Change the settings in the profilers to reflect these values. Click the value in red beneath each plot’s horizontal axis and enter the new value.
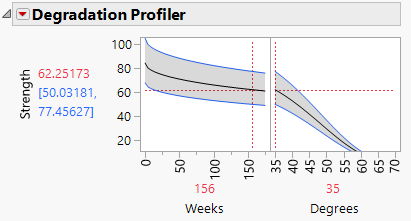
1. In the Degradation profiler for the Arrhenius model, set Weeks to 156 and Degrees to 35.
Figure 9.7 Degradation Profiler
The predicted Strength at these settings is 62.25, with a 2.5% quantile of 50.03. Failures are not very likely at these or less extreme settings.
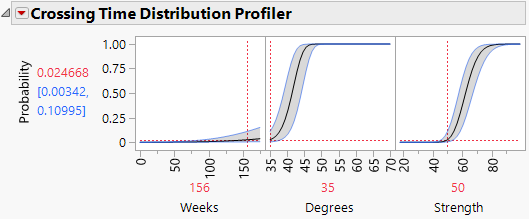
2. In the Crossing Time Distribution Profiler, set Weeks to 156, Degrees to 35, and Strength to 50.
Figure 9.8 Crossing Time Distribution Profiler
At 156 weeks at a temperature of 35 degrees Celsius, the probability that the value of Strength is less than 50 is 0.024668. The 95% confidence interval ranges from 0.00342 to 0.10995. The probability of failure at these or less extreme conditions is about 2%.
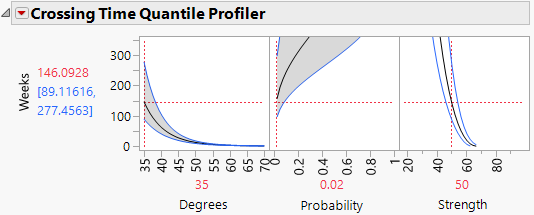
3. In the Crossing Time Quantile Profiler, set Degrees to 35, Probability to 0.02, and Strength to 50.
4. Adjust the vertical axis of the Crossing Time Quantile Profiler so that the maximum value is about 350.
Figure 9.9 Crossing Time Quantile Profiler
The number of weeks within which 2% of units fail at a temperature of 35 degrees Celsius is estimated to be 146.09.The 95% confidence interval ranges from 89.12 to 277.46.
