 Example Using the Reliability Block Diagram Platform
In this example, you learn how to create a new Reliability Block Diagram.
1. Select Analyze > Reliability and Survival > Reliability Block Diagram.
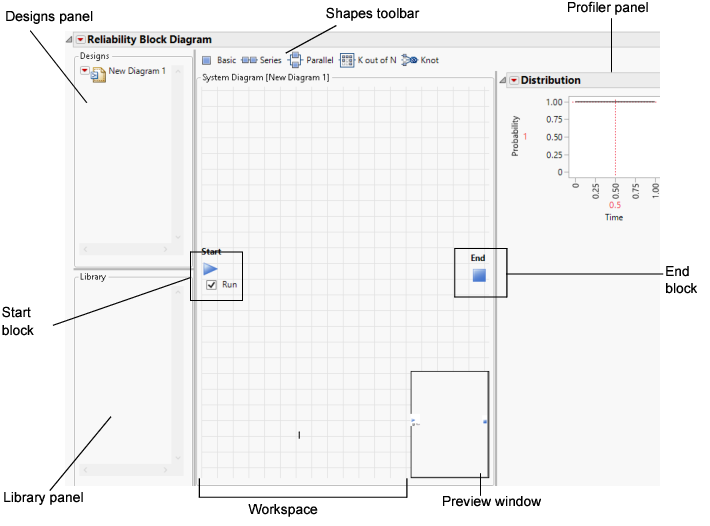
A blank Reliability Block Diagram window appears.
Figure 12.2 New Reliability Block Diagram
Note: The Distribution profiler appears by default.
2. In the Designs panel, select and rename New Diagram 1 to Computer.
The Workspace is now named System Diagram [Computer].
3. Deselect Run in the Start block.
With Run selected, the platform updates the diagram’s reliability calculations after each change to the system diagram. These changes can include adding or deleting components, changing a component’s configuration, and adding or deleting a connection.
With Run deselected, the platform does not update the reliability calculations after any changes.
Tip: Deselect Run when you are diagramming large systems. Select Run when the diagram is complete.
4. Proceed with Add Components.
Add Components
The Reliability Block Diagram drawing elements that are located in the toolbar are called shapes. The term component refers to a shape that represents a constituent part of the system.
1. Click the Basic icon ![]() on the Shape toolbar and drag the shape to the System Diagram to the right of the Start block.
on the Shape toolbar and drag the shape to the System Diagram to the right of the Start block.
2. Select the label, replace New Basic 1 by Power Supply, and press Enter.
Figure 12.3 Basic Shape
When you click the label or the shape, connection arrows appear. The arrows disappear when you click elsewhere in the template.
3. Drag a second Basic shape to the right of the Power Supply shape.
4. Select the label and type CPU.
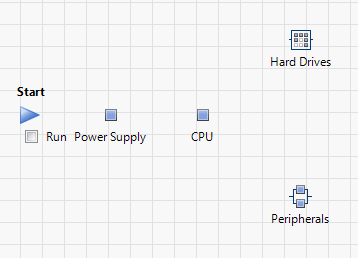
Figure 12.4 Example System Diagram
Note: You will align the shapes later, in the section Align Shapes.
5. Drag a Parallel shape ![]() to a position to the right and below the CPU shape.
to a position to the right and below the CPU shape.
6. Select the label and type Peripherals.
7. Drag a K out of N shape ![]() to a position to the right and above the CPU shape.
to a position to the right and above the CPU shape.
8. Select the label and type Hard Drives.
Figure 12.5 Partial System Diagram
9. Drag a Knot shape ![]() to the right of the previous shapes.
to the right of the previous shapes.
10. Select the label and type Join.
11. Drag a Series shape ![]() to a position to the right of the Knot shape.
to a position to the right of the Knot shape.
12. Select the label and type Input Devices.
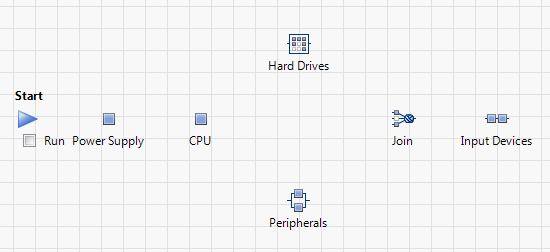
Figure 12.6 Partial System Diagram
13. Drag a Basic shape to a position to the right of the Input Devices shape.
14. Select the label and type Monitor.
Figure 12.7 System Diagram Showing All Shapes
15. Proceed with Align Shapes.
Align Shapes
1. To vertically align the shapes for Hard Drives and Peripherals, select the components:
– Hard Drives
– Peripherals
Tip: To select shapes, drag the cursor around the shapes or press Shift and click each shape.
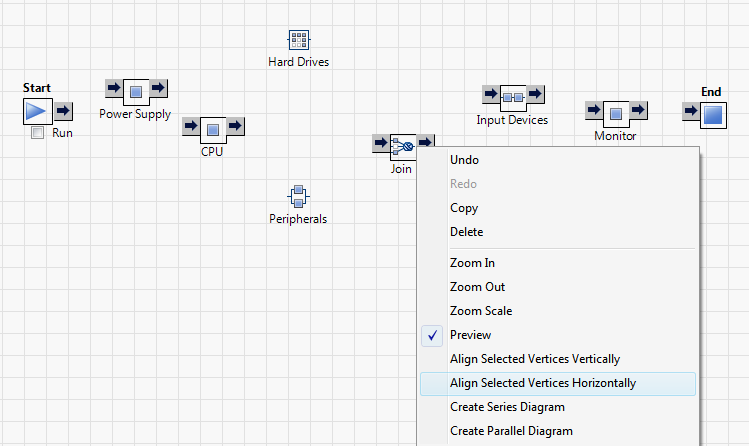
2. With the shapes selected, right-click one of the shapes and select Align Selected Vertices Vertically.
3. To horizontally align the remaining shapes, select the following components:
– Start
– Power Supply
– CPU
– Join
– Input Devices
– Monitor
– End
4. With the shapes selected, right-click one of the shapes and select Align Selected Vertices Horizontally.
Figure 12.8 Align Shapes Horizontally
5. Proceed with Connect Shapes.
Connect Shapes
To connect shapes, select a shape to display its connection arrows. Suppose you want to connect shape A to shape B. Select shape A. Drag the right arrow to shape B to indicate that shape A precedes shape B. Drag the left arrow to shape B to indicate that shape B precedes shape A. To connect the shapes in your diagram, select the right arrows to connect to the next shape in the sequence.
1. Select the Start block (blue arrow) to display the connection arrow.
2. Select the single connection arrow ![]() and drag it to the Power Supply component.
and drag it to the Power Supply component.
Figure 12.9 Connecting Shapes
3. For each of the following components, click the first component, select its right connection arrow, and drag the arrow to the second component:
1. Power Supply → CPU
2. CPU → Hard Drive
3. CPU → Peripherals
4. Hard Drives → Join
5. Peripherals → Join
6. Join → Input Devices
7. Input Devices → Monitor
8. Monitor → End block
Figure 12.10 Completed System Diagram
4. Proceed with Configure Components.
Configure Components
1. In the Configuration panel, enter the Configuration settings for the components. See Configuration Settings.
Component | Settings |
|---|---|
Power Supply | • Distribution—Exponential • Theta—1 |
CPU | • Distribution—Exponential • Theta—1 |
Peripherals | • Distribution—Weibull • Alpha—1 • Beta—2 • N—3 |
Hard Drives | • Distribution—Weibull • Alpha—2 • Beta—1 • K—1 • N—4 |
Join | Minimum available—1 |
Input Devices | • Distribution—Fréchet • Location—0 • Scale—1 • N—2 |
Monitor | • Distribution—Exponential • Theta—1 |
The Reliability Block Diagram is complete.
2. Select Run.
The system’s reliability information is updated. This is reflected in the Distribution plot in the Profiler pane.
3. To save the Reliability Block Diagram as a JMP Scripting Language (JSL) file, select File > Save and name it exampleRBDcomplete.jsl.


