Publication date: 06/27/2024
Examples of Display Boxes
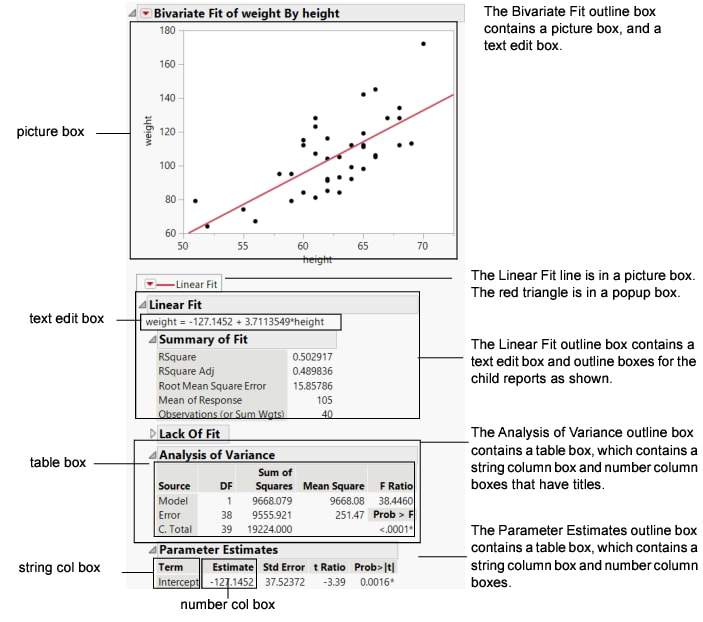
Figure 11.1 shows a Bivariate report that consists of several common display boxes.
Figure 11.1 Display Boxes in a Report
Run the following script to create the report:
dt = Open( "$SAMPLE_DATA/Big Class.jmp" );
biv = dt << Bivariate( Y( :weight ), X( :height ), Fit Line() );Want more information? Have questions? Get answers in the JMP User Community (community.jmp.com).
