Fit Model
The Fit Model option in the Recurrence Analysis platform is used to fit models for the Recurrence Intensity and Cumulative functions. There are four models available for describing the intensity and cumulative functions. You can fit the models with constant parameters, or with parameters that are functions of effects.
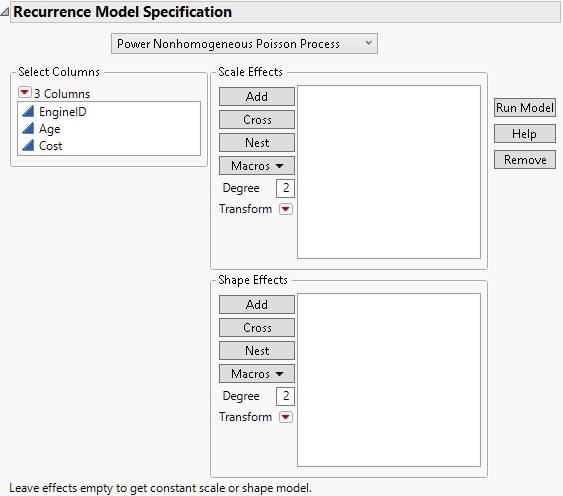
Select Fit Model from the Recurrence Analysis red triangle menu to produce the Recurrence Model Specification window shown in Figure 7.5.
Figure 7.5 Recurrence Model Specification
You can select one of four models, with the following Intensity and Cumulative functions:
Power Nonhomogeneous Poisson Process
I(t) = 
C(t) = 
Proportional Intensity Poisson Process
I(t) = 
C(t) = 
Loglinear Nonhomogeneous Poisson Process
I(t) = 
C(t) =  =
= 
Homogeneous Poisson Process
I(t) = 
C(t) = 
where t is the age of the product.
Table 7.1 defines each model parameter as a scale parameter or a shape parameter.
Model | Scale Parameter | Shape Parameter |
|---|---|---|
Power NHPP | θ | β |
Proportional Intensity PP | γ | δ |
Loglinear NHPP | γ | δ |
Homogeneous PP | γ | none |
Note the following:
• For the Recurrence Model Specification window (Figure 7.5), if you include Scale Effects or Shape Effects, the scale and shape parameters in Table 7.1 are modeled as functions of the effects. To fit the models with constant scale and shape parameters, do not include any Scale Effects or Shape Effects.
• The Homogeneous Poisson Process is a special case compared to the other models. The Power NHPP and the Proportional Intensity Poisson Process are equivalent for one-term models, but the Proportional Intensity model seems to fit more reliably for complex models.
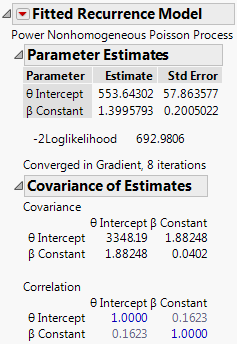
Click Run Model to fit the model and see the model report.
Figure 7.6 Model Report
The Fitted Recurrence Model red triangle menu contains the following options:
Profiler
Shows or hides the Profiler showing the Intensity and Cumulative functions.
Effect Marginals
Evaluates the parameter functions for each level of the categorical effect, holding other effects at neutral values. This helps you see how different the parameter functions are between groups. This is available only when you specify categorical effects.
Test Homogeneity
Tests if the process is homogeneous. This option is not available for the Homogeneous Poisson Process model.
Effect Likelihood Ratio Test
Produces a test for each effect in the model. This option is available only if there are effects in the model.
Specific Intensity and Cumulative
Computes the intensity and cumulative values associated with particular time and effect values. The confidence intervals are profile likelihood intervals.
Specific Time for Cumulative
Computes the time associated with a particular number of recurrences and effect values.
Save Intensity Formula
Saves the Intensity formula to the data table.
Save Cumulative Formula
Saves the Cumulative formula to the data table.
Publish Intensity Formula
Creates the Intensity formula and saves it as a formula column script in the Formula Depot platform. If a Formula Depot report is not open, this option creates a Formula Depot report. See Formula Depot in Predictive and Specialized Modeling.
Publish Cumulative Formula
Creates the Cumulative formula and saves it as a formula column script in the Formula Depot platform. If a Formula Depot report is not open, this option creates a Formula Depot report. See Formula Depot in Predictive and Specialized Modeling.
Simulate from Model
Enables you to simulate new data from the estimated recurrence model. This option creates a new data table of simulated observations that are based on options that are specified in the Simulate from Model window. See Simulate from Model.
Remove Fit
Removes the model report.
Simulate from Model
When you select the Simulate from Model option from the Fitted Recurrence Model red triangle menu, the Simulate from Model window appears. This window contains the following specifications for the simulation:
Maximum Number of Events
Specifies the maximum number of events to be simulated in each level of the System ID.
Maximum Age
Specifies the maximum time for a simulated event.
Number of Units
Specifies the number of units in each level of the System ID.
Note: If the model contains terms other than the Intercept and Constant terms, the simulated data table contains this number of units for all level combinations of the regression terms. If the regression term is continuous, it is divided into 5 levels.
After you click OK, a new data table that contains the results appears. This table contains a script that enables you to analyze the simulated observations in the Recurrence platform.

