Gauge R&R Report
In the Variability Chart platform, the Gauge R&R report shows measures of variation interpreted for a gauge study of operators and parts. There is a full version of the Gauge R&R report and a reduced version. To generate the reduced Gauge R&R report, select File > Preferences > Platforms > Variability Chart > Reduced Gauge R&R Report.
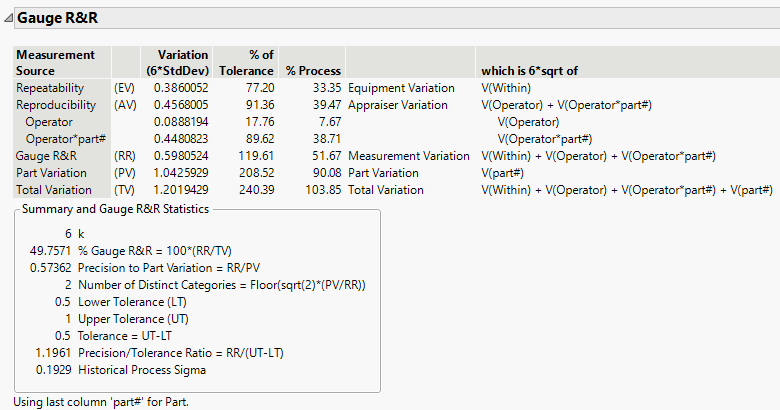
Figure 6.7 Example of the Full Gauge R&R Report
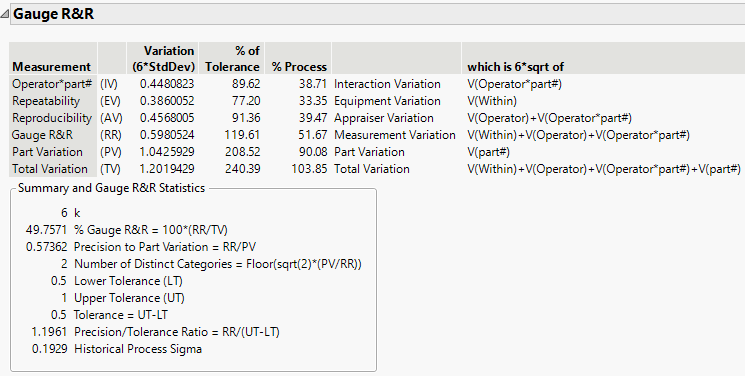
Figure 6.8 Example of the Reduced Gauge R&R Report
The table in the Gauge R&R report contains the following information:
Measurement Source
Defines the source of measurement for the variation.
Variation (k*StdDev)
The square roots of sums of variance components scaled by the value of the sigma multiplier, k.
% of Tolerance
(Available only if you specified a tolerance range or lower and upper tolerance values.) Provides the % of tolerance computed as 100*(Variation/Tolerance).
% Process
(Available only if you specified a historical process sigma.) Provides the % of process computed as 100*(Variation/(k*Historical Sigma)).
which is k*sqrt of
The descriptions of how the variance component sums are calculated.
Note: To add columns to the Gauge R&R report, right-click on the column heading and select Columns.
The Gauge R&R report also contains a Summary and Gauge R&R statistics section. This includes specified values, summaries, and other statistics. If you specified a tolerance range or lower and upper tolerance values, a Precision-to-Tolerance ratio is included in this section. This ratio represents the proportion of the tolerance or capability interval that is lost due to gauge variability. The % Gauge R&R value is also shown in this section, which is the percentage of the total variation that is made up by the measurement variation. Table 6.2 shows guidelines for the percent measurement variation, as suggested by Barrentine (1991).
< 10% | excellent |
11% to 20% | adequate |
21% to 30% | marginally acceptable |
> 30% | unacceptable |
Variance Components for Gauge R&R
The Variance Components for Gauge R&R table in the Gauge R&R report contains the different variance components from the model. These are the variance components used to compute that variation in the initial table of the Gauge R&R report.

