Launch the Model Driven Multivariate Control Chart Platform
Launch the Model Driven Multivariate Control Chart (MDMVCC) platform by selecting Analyze > Quality and Process > Model Driven Multivariate Control Chart.
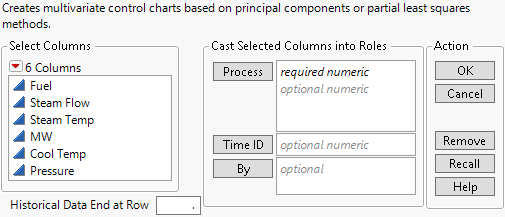
Figure 13.6 The Model Driven Multivariate Control Chart Launch Window
For more information about the options in the Select Columns red triangle menu, see Column Filter Menu in Using JMP.
The MDMVCC platform launch window contains the following options:
Process
Assigns the process columns. See Data Format.
Time ID
Assigns a column that is used to identify samples. If no Time ID is assigned, the row number identifies the observations. If the Time ID column is a time, the time identifies each sample. Otherwise, the numeric value of the Time ID identifies each sample.
By
Produces a separate report for each level of the By variable. If more than one By variable is assigned, a separate report is produced for each possible combination of the By variables.
Historical Data End at Row
Specifies a row number to indicate where historical data end. This enables you to calculate chart limits based on historical data. Both historical and current data are plotted on the charts. Historical data are also known as Phase I data, and current data are also known as Phase II data.
Data Format
The Model Driven Multivariate Control Chart (MDMVCC) platform accepts data in the following three allowable data formats:
Raw Data
Use continuous process data to build a control chart that is based on the principal components of the data. The default dimension of the control chart is based on the number of principal components that account for 85% of the process variation. This number is based on the cumulative percent of the principal component eigenvalues.
Principal Components
Use principal component columns that were previously saved from a principal component analysis (PCA). The default dimension of the control chart is the number of components specified as process variables.
Partial Least Squares Score Data
Use score columns that were previously saved from a partial least squares (PLS) analysis to build a control chart that is based on the score columns. The default dimension of the control chart is the number of scores specified as process variables.
Notes:
• PCA or PLS models built with a frequency or weight column are not supported.
• PCA or PLS models built with historical data must use the same number of historical data rows as specified in the MDMVCC launch window.
• PCA models built from within the Multivariate platform are not supported.
