Publication date: 06/27/2024
Select Rows in JMP Graphs
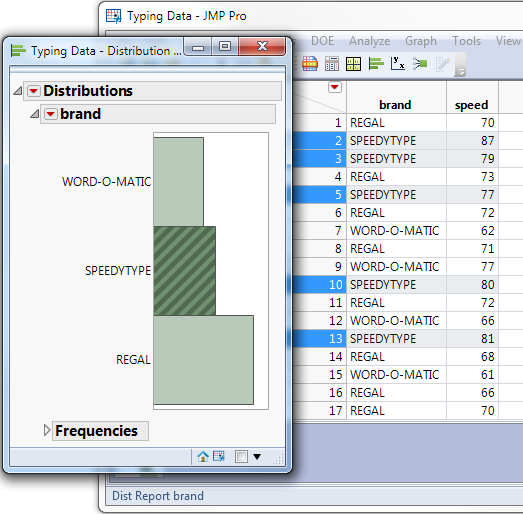
All graphs and plots that represent the same data table are linked to each other and to the corresponding JMP data table. When you click points in plots or bars of a graph, the corresponding rows highlight in the data table. The example in Figure 9.20 shows a histogram with the SPEEDYTYPE bar highlighted, and the corresponding rows highlighted in the table. You can also extend the selection of bars in a histogram by pressing Shift and then making your selection.
Figure 9.20 Highlighting Rows in a Histogram
Want more information? Have questions? Get answers in the JMP User Community (community.jmp.com).
