Share Reports as Interactive HTML
Interactive HTML enables you to share JMP reports that contain dynamic graphs so that even non JMP users can explore the data. JMP reports are saved as an interactive web page that you can share with others (for example, on a shared network drive, by email, or on a website). Users then explore the data as they would in JMP.
Interactive HTML Contains Data
When you export or publish a report as interactive HTML, your data are embedded in the HTML. The content is unencrypted, because web browsers cannot read encrypted data. To avoid sharing sensitive data, export your results as a non-interactive web page instead by selecting File > Export > HTML.
Which Features Are Supported Interactively
Interactive HTML provides a subset of features from JMP:
• If the features in your report are fully supported, the web page is created with no warnings.
• If your report contains unsupported features, you see a message in the export or publish window that interactive HTML is partially implemented. For details, see the JMP log (View > Log).
• Partially or unsupported features appear static in the web page. If you hover over an unsupported feature in the web page, a tooltip says that the feature is not yet interactive.
For information about exploring interactive HTML output, visit www.jmp.com/interactive.
Export a Single Report as Interactive HTML
To export a single JMP report as interactive HTML, use the Export as Interactive HTML with Data option to create a single web page.
1. In JMP, create the report and make it the active window.
Note: If a report contains a Local Data Filter, it is static in the web report and users cannot change the selections. To make the Local Data Filter interactive, deselect the Include mode. (In Graph Builder, to see the Include mode, select Show Modes from the Local Data Filter red triangle menu.)
2. Select File > Export, select Interactive HTML with Data and click Next.
3. Navigate to where you want to save the file.
4. (Optional) Rename the file.
5. Keep the Open the file after saving option selected.
6. Click Save.
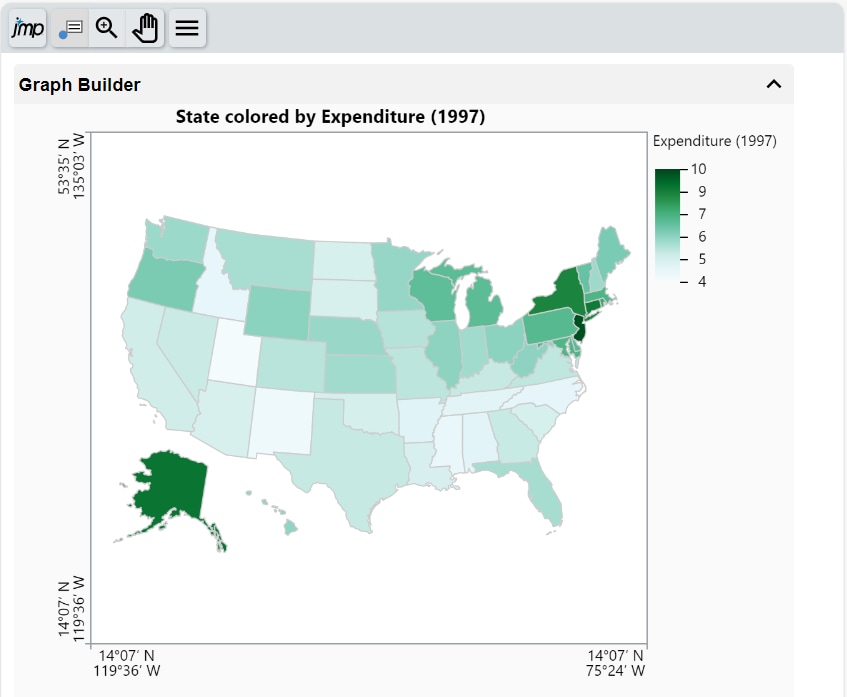
The output is saved in the selected folder and opens in a browser.
Figure 11.2 Web Page for Single Interactive HTML Report
Publish Multiple Reports as Interactive HTML
To publish multiple JMP reports as interactive HTML, use the Publish to File option, which creates an index page that contains the reports.
Tip: When you publish multiple JMP reports, you specify where to save the index page and report files. You can choose a shared network folder and provide the location to others, or choose a folder on your computer and zip the files before sharing. This is particularly helpful if you are sharing with non JMP users.
1. In JMP, create the reports.
Note: If a report contains a Local Data Filter, it is static in the web report and users cannot change the selections. To make the Local Data Filter interactive, deselect the Include mode. (In Graph Builder, to see the Include mode, select Show Modes from the Local Data Filter red triangle menu.)
2. From a report window, select File > Publish > Publish to File.
3. Select the reports that you want to publish.
4. (Optional) Change where the parent folder resides or change the name of the subfolder that will contain the reports.
5. Click Next.
6. Enter a title for the index page. You can also update the report titles.
7. (Optional) Change additional options. See Interactive HTML Report Options.
8. Click Publish.
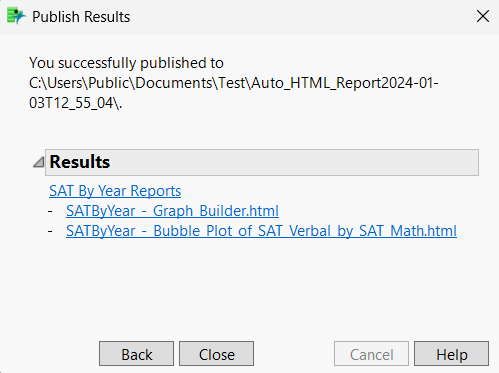
Figure 11.3 Index Page for Multiple Interactive HTML Reports
9. Click a report title to open a report.
For details about working with interactive reports, from an HTML report, click ![]() > Help. This opens the help at www.jmp.com/interactive.
> Help. This opens the help at www.jmp.com/interactive.
Interactive HTML Report Options
Title
Add a title for the index page (multiple reports only) or the reports.
Description
(Optional) Add a description to the index page or the reports. The description will appear under the titles.
Customize
(Appears for multiple reports only) Change the appearance of the web page. You can change the style, theme, font, logo, and whether the date or time appears. See Customize Index Page Options.
Close reports after running
Closes the reports in JMP once you publish the web report.
Publish Data
Select this for interactive reports. If you deselect this option, the reports are static.
Note: To avoid sharing sensitive data, save your results as a non-interactive web page. (For a single report, select File > Export > HTML. For multiple reports, select File > Publish > Publish to File and deselect Publish Data.)
Add Image
Adds an image to the web page. You can move the image up or down using the Arrow icons.
Delete icon ![]()
(Appears for multiple reports only) Deletes a report.
Arrow icons ![]()
(Appears for multiple reports only) Changes the order of reports.
Customize Index Page Options
Style Format
Determines the layout of the reports.
Large List
Shows the reports in a column with large thumbnail graphics.
Small List
Shows the reports in a column with small thumbnail graphics.
Grid
Shows the reports in rows.
Custom CSS
Enables you to specify a CSS file to format the web page. The CSS file is copied into a subfolder called _css. The link to the CSS file is relative so that you can send the report and support files to another user and maintain the CSS formatting.
Color Theme
Specifies the color of the web page, headings, and borders. The default web page has a white background, orange headings, and blue borders.
Change Font
Change the font applied in the reports.
Change Logo
Specifies an image to display along with the reports. Click the up or down arrow next to the image to move it above or below the reports.
Show date/time
Shows or hides the date and time at which the web page was generated.

