Publication date: 06/27/2024
Specify Line Types in JMP Graphs
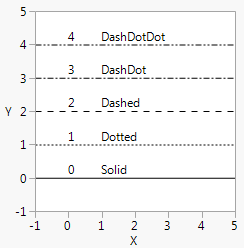
You can also control Line Style() by number (0–4) or name (Solid, Dotted, Dashed, DashDot, DashDotDot). Figure 12.21 shows the numerical values for each line type.
linestyles = {"Solid", "Dotted", "Dashed", "DashDot", "DashDotDot"};
win = New Window( "Line Styles",
Graph Box(
Frame Size( 200, 200 ),
X Scale( -1, 5 ),
Y Scale( -1, 5 ),
For( i = 0, i < 5, i++,
Line Style( i );
H Line( i );
Text( {0, i + .1}, i );
Text( {1, i + .1}, linestyles[i + 1] );
)
)
);
Figure 12.21 Line Styles
To control the thickness of lines, set a Pen Size and specify the line width in pixels. The default is 1 for single-pixel lines. For printing, think of Pen Size as a multiplier for the default line width, which varies according to your printing device.
win = New Window( "Pen Size",
Graph Box(Pen Size( 2 ); // double-width lines
Line( [10 30 90], [88 22 44] );
)
);
Want more information? Have questions? Get answers in the JMP User Community (community.jmp.com).
