Statistical Details for Comparison Circles
In the Oneway platform, comparison circles are a graphical representation of the least significant difference (LSD) in a multiple comparison test. This least significant difference is a probability quantile multiplied by the standard error of the difference of the two means. For the Each Pairs option, the Fisher LSD is used and the probability quantile is the Student’s t-statistic. The comparison circles calculations are demonstrated for this case. The LSD is defined as follows:

The standard error of the difference of two independent means is calculated from the following relationship:

When the means are uncorrelated, these quantities have the following relationship:

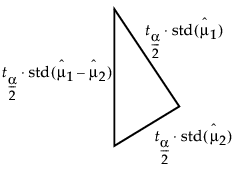
These squared values form a Pythagorean relationship, illustrated graphically by the right triangle shown in Figure 6.41.
Figure 6.41 Relationship of the Difference between Two Means
The hypotenuse of this triangle is a measuring stick for comparing means. The means are significantly different if and only if the actual difference is greater than the hypotenuse (LSD).
Suppose that you have two means that are exactly on the borderline, where the actual difference is the same as the least significant difference. Draw the triangle with vertices at the means measured on a vertical scale. Also, draw circles around each mean so that the diameter of each is equal to the confidence interval for that mean.
Figure 6.42 Geometric Relationship of t Test Statistics
The radius of each circle is the length of the corresponding leg of the triangle, which is  .
.
The circles must intersect at the same right angle as the triangle legs, giving the following relationship:
• If the means differ exactly by their least significant difference, then the confidence interval circles around each mean intersect at a right angle. That is, the angle of the tangents is a right angle.
Now, consider how these circles must intersect if the means are different by greater than or less than the least significant difference:
• If the circles intersect so that the outside angle is greater than a right angle, then the means are not significantly different. If the circles intersect so that the outside angle is less than a right angle, then the means are significantly different. An outside angle of less than 90 degrees indicates that the means are farther apart than the least significant difference.
• If the circles do not intersect, then they are significantly different. If they nest, they are not significantly different (Figure 6.9).
The same graphical technique works for many multiple-comparison tests, substituting a different probability quantile value for the Student’s t.

