Statistical Details for Profile Likelihood Confidence Limits
The upper and lower confidence limits for the parameters in the Nonlinear platform are based on a search for the value of each parameter after minimizing with respect to the other parameters. The search looks for values that produce an SSE greater by a certain amount than the solution’s minimum SSE. The goal of this difference is based on the F-distribution. The intervals are sometimes called likelihood confidence intervals or profile likelihood confidence intervals (Bates and Watts 1988; Ratkowsky 1990).
Profile confidence limits all start with a goal SSE. This is a sum of squared errors (or sum of loss function) that an F test considers significantly different from the solution SSE at the given alpha level. If the loss function is specified to be a negative log-likelihood, then a Chi-square quantile is used instead of an F quantile. For each parameter’s upper confidence limit, the parameter value is increased until the SSE reaches the goal SSE. As the parameter value is moved up, all the other parameters are adjusted to be least squares estimates subject to the change in the profiled parameter. Conceptually, this is a compounded set of nested iterations. Internally there is a way to do this with one set of iterations developed by Johnston and DeLong. See the SAS/ETS User’s Guide (SAS Institute Inc. 2023).
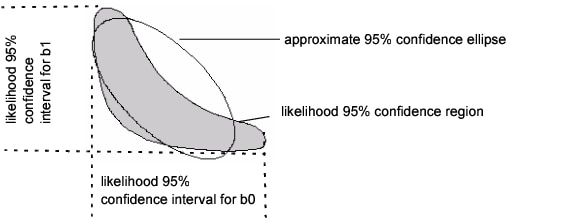
Figure 15.30 shows the contour of the goal SSE or negative likelihood, with the least squares (or least loss) solution inside the shaded region:
• The asymptotic standard errors produce confidence intervals that approximate the region with an ellipsoid and take the parameter values at the extremes (at the horizontal and vertical tangents).
• Profile confidence limits find the parameter values at the extremes of the true region, rather than the approximating ellipsoid.
Figure 15.30 Diagram of Confidence Limits for Parameters
Likelihood confidence intervals are more trustworthy than confidence intervals calculated from approximate standard errors. If a particular limit cannot be found, computations begin for the next limit. When you have difficulty obtaining convergence, try the following:
• use a larger alpha, resulting in a shorter interval, more likely to be better behaved
• relax the confidence limit criteria.
