Example: Apply a Platform Preset
This example applies a preset to check the normality of a continuous variable.
First you run an analysis on a table and produce a report. Then you apply a sample preset to that report to add details and modify formatting.
To create the report and apply the preset:
1. Select Help > Sample Data Folder and open Tablet Production.jmp.
2. Select Analyze > Distribution.
3. Select Disso and click Y, Columns, and then click OK.
4. In the Disso menu bar, click the Platform Presets button ![]() and select Sample Presets > Check Normality.
and select Sample Presets > Check Normality.
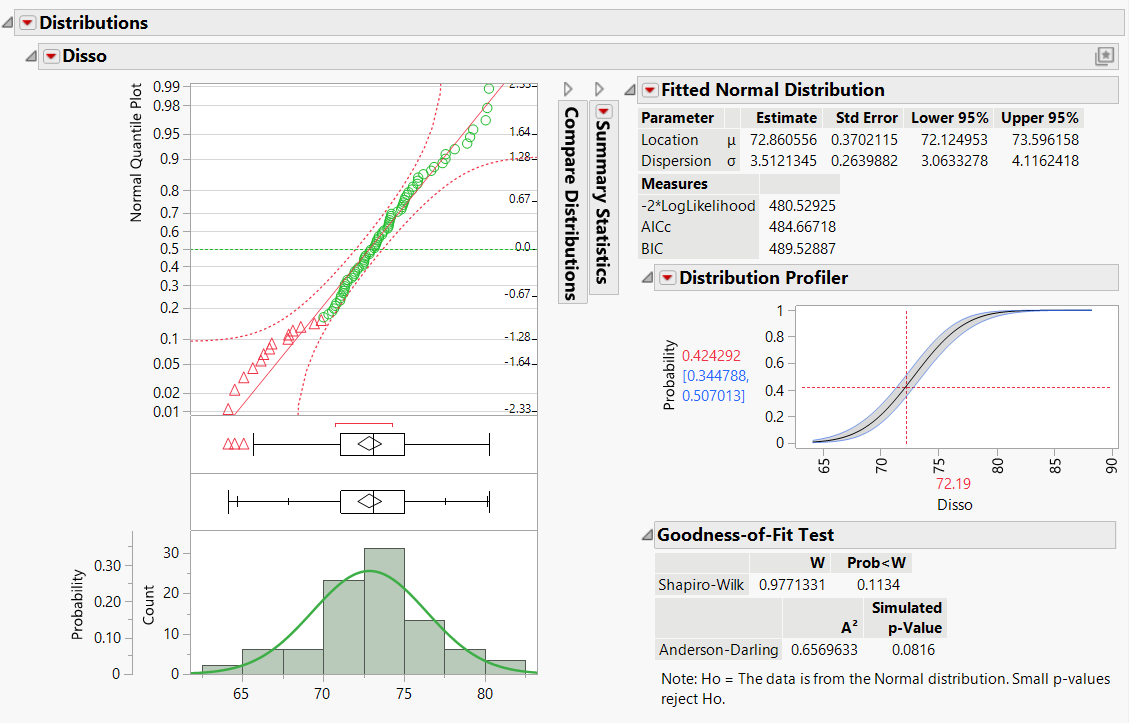
Figure 10.2 The Distribution report updated by the Check Normality Platform Preset
The Check Normality Platform Preset minimizes the Summary Statistics and adds the following to the report window:
• a Normal Quantile Plot of the Disso variable
• the Fitted Normal Distribution report
• a Distribution Profiler
• a Goodness-of-Fit Test
Because the normal quantile plot approximates a straight diagonal line, the Disso variable appears to be normally distributed.
