发布日期: 09/18/2023
Specify Line Types in JMP Graphs
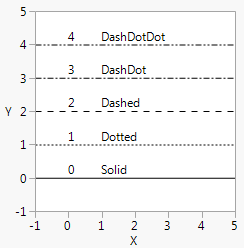
You can also control Line Style() by number (0–4) or name (Solid, Dotted, Dashed, DashDot, DashDotDot). 图 12.21 shows the numerical values for each line type.
linestyles = {"Solid", "Dotted", "Dashed", "DashDot", "DashDotDot"};
win = New Window( "Line Styles",
Graph Box(
Frame Size( 200, 200 ),
X Scale( -1, 5 ),
Y Scale( -1, 5 ),
For( i = 0, i < 5, i++,
Line Style( i );
H Line( i );
Text( {0, i + .1}, i );
Text( {1, i + .1}, linestyles[i + 1] );
)
)
);
Figure 12.21 Line Styles
To control the thickness of lines, set a Pen Size and specify the line width in pixels. The default is 1 for single-pixel lines. For printing, think of Pen Size as a multiplier for the default line width, which varies according to your printing device.
win = New Window( "Pen Size",
Graph Box(Pen Size( 2 ); // double-width lines
Line( [10 30 90], [88 22 44] );
)
);
需要更多信息?有问题?从 JMP 用户社区得到解答 (community.jmp.com).
