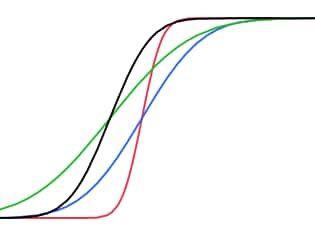
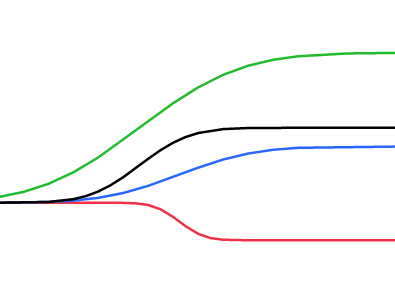
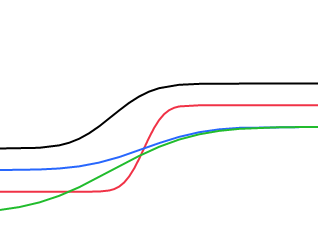
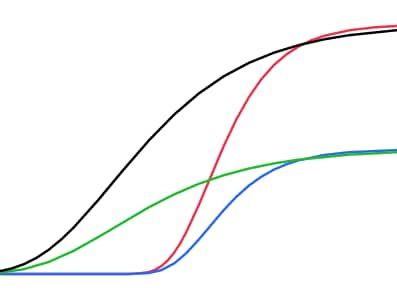
拟合曲线模型的统计详细信息
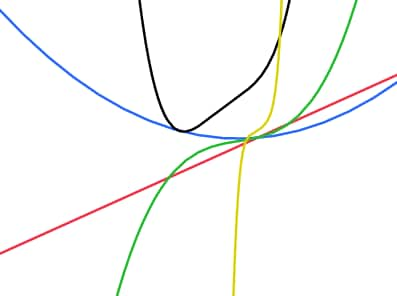
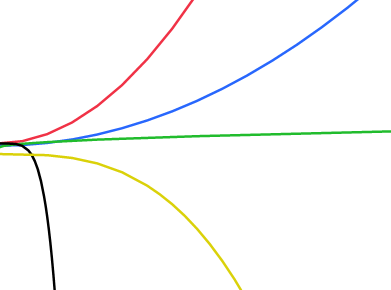
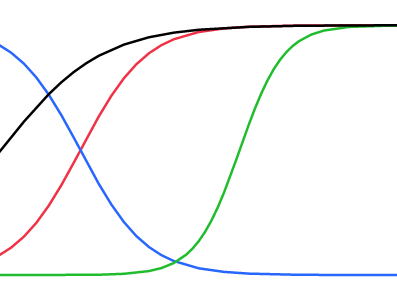
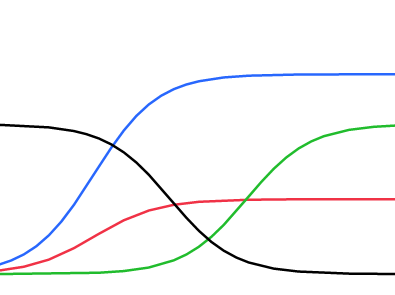
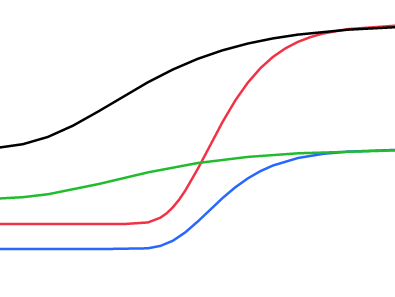
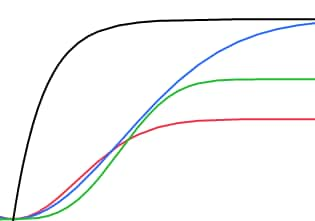
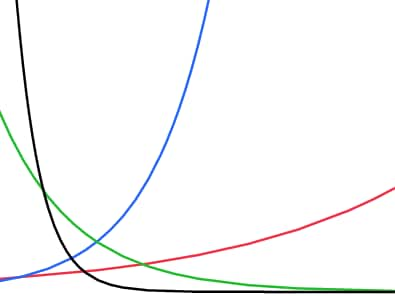
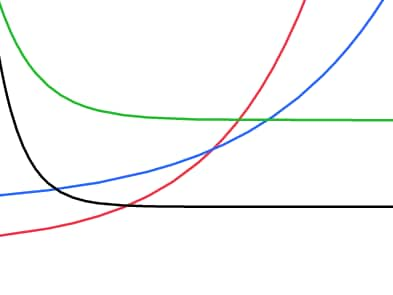
“拟合曲线”红色小三角菜单中可用的模型公式汇总在表 14.1 中。
|
模型 |
公式 |
|---|---|
|
多项式
|
其中,k 是多项式的阶数。您也可以使用“拟合模型”平台和“以 X 拟合 Y”平台拟合这些模型。 |
|
功效模型
|
a = 截距 b = 斜率 c = 功效 仅当响应值和 x 值均为非负值时才可用。 |
|
双参数 Logistic
|
a = 增长率 b = 拐点 仅当所有响应值都介于 0 到 1 之间时才可用。 |
|
三参数 Logistic
|
a = 增长率 b = 拐点 c = 渐近线 |
|
四参数 Logistic
|
a = 增长率 b = 拐点 c = 下渐近线 d = 上渐近线 |
|
四参数 Logistic Rodbard
|
a = 增长率 b = 拐点 c = 下渐近线 d = 上渐近线 仅当 x 值为正时才可用。 |
|
四参数 Logistic Hill
|
a = 增长率 b = 拐点 c = 下渐近线 d = 上渐近线 |
|
五参数 Logistic
|
a = 增长率 b = 拐点 c = 渐近线 1 d = 渐近线 2 f = 幂次 |
|
双参数 Probit
|
a = 增长率 b = 拐点 F = 正态分布 CDF 仅当所有响应值都介于 0 到 1 之间时才可用。 |
|
双参数 Probit
|
a = 增长率 b = 拐点 c = 渐近线 F = 正态分布 CDF 0 处也有一条渐近线。 |
|
四参数 Probit
|
a = 增长率 b = 拐点 c = 下渐近线 d = 上渐近线 F = 正态分布 CDF |
|
三参数 Gompertz
|
a = 渐近线 b = 增长率 c = 拐点 |
|
四参数 Gompertz
|
a = 下渐近线 b = 上渐近线 c = 增长率 d = 拐点 |
|
Weibull 生长
|
a = 上渐近线 b = 增长率 c = 拐点 仅当响应值和 x 值均为非负值时才可用。 |
|
双参数指数
|
a = 尺度 b = 增长率 |
|
三参数指数
|
a = 渐近线 b = 尺度 c = 增长率 |
|
四参数双指数
|
a = 尺度 1 b = 衰减率 1 c = 尺度 2 d = 衰减率 2 仅当响应值为正时才可用。 |
|
五参数双指数
|
a = 渐近线 b = 尺度 1 c = 衰减率 1 d = 尺度 2 f = 衰减率 2 |
|
机理生长
|
a = 渐近线 b = 尺度 c = 增长率 |
|
混合指数
|
a = 最大值 b = 尺度 c = 比率 d = 功效 仅当响应值和 x 值均为非负值时才可用。 |
|
四参数细胞生长
|
a = 峰值(若为死亡比率)d 为零 b = 时间 0 处的响应 c = 单元格分区比率 d = 单元格死亡比率 仅当响应值为正且 x 值非负时才可用。 |
|
高斯峰
|
a = 峰值 b = 临界点 c = 增长率 |
|
ExGaussian 峰(指数修正的高斯峰)
|
a = AUC(曲线下区域) b = 位置 c = 尺度 d = Lambda f = 标准正态 pdf |
|
Lorentzian 峰
|
a = 峰值 b = 增长率 c = 临界点 |
|
单室口服剂量模型
|
a = 曲线下面积 b = 消除率 c = 吸收率 仅当响应值和 x 值全为正值时才可用。 |
|
双室静脉注射剂量模型
|
a = b = a = 初始浓度 b = 入向传输率 c = 出向传输率 d = 消除率 仅当响应值和 x 值全为正值时才可用。 |
|
Michaelis-Menten 方程
|
a = 最大速度 b = Michaelis 常数 仅当响应值和 x 值全为正值时才可用。 |
|
反转 Michaelis-Menten 方程
|
a = 最大速度 b = Michaelis 常数 仅当响应值和 x 值全为正值时才可用。 |
|
一阶比率
|
a = 初始值 b = 比率常数 仅当 x 值非负时才可用。 |
|
带限值的一阶
|
a = 初始值 b = 限制值 c = 比率常数 仅当 x 值非负时才可用。 |
|
带均衡的一阶
|
a = 初始值 b = 前进比率 c = 后退比率 仅当 x 值非负时才可用。 |
|
二阶
|
a = 初始值 b = 比率常数 仅当 x 值非负时才可用。 |
|
带两个成分的二阶
|
a = 初始值 b = 偏移 c = 比率常数 仅当所有 x 值非负时才可用。 |
|
Antoine 方程
|
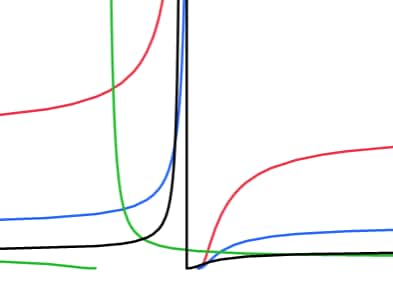
a = 成分特定的常数 b = 成分特定的常数 c = 成分特定的常数 仅当响应值大于 0 时才可用。 垂直渐近线位于 10a 的位置。 水平渐近线位于 −c 的位置。 |
|
Higuchi
|
a = 释放常数 仅当所有 x 和 y 值均为非负时才可用。 |
|
带滞后的 Higuchi
|
a = 释放常数 b = 时滞 仅当所有 x 和 y 值均为非负时才可用。 |
|
带突发的 Higuchi
|
a = 释放常数 b = 突发 仅当所有 x 和 y 值均为非负时才可用。 |
|
Hixson-Crowell
|
a = 释放常数 仅当所有 x 和 y 值均为非负时才可用。 |
|
带滞后的 Hixson-Crowell
|
a = 释放常数 仅当所有 x 和 y 值均为非负时才可用。 |
|
Korsmeyer-Peppas
|
a = 释放常数 b = 扩散指数 仅当所有 x 和 y 值均为非负时才可用。 |
|
带滞后的 Korsmeyer-Peppas
|
a = 释放常数 b = 扩散指数 c = 时滞 仅当所有 x 和 y 值均为非负时才可用。 |
|
带突发的 Korsmeyer-Peppas
|
a = 释放常数 b = 扩散指数 c = 突发 仅当所有 x 和 y 值均为非负时才可用。 |
