|
1.
|
|
3.
|
Select File > New > Application.
|
|
4.
|
Select Blank Application.
|
|
6.
|
|
7.
|
Select Edit > Select All.
|
|
8.
|
Select Format > Add Container > H List Box to align the reports horizontally.
|
|
9.
|
|
10.
|
From the Application red triangle menu, select Run Application.
|
|
11.
|
|
12.
|
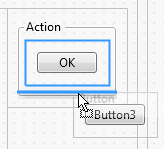
Click OK.
|

提示:The absolute path to the data table is inserted automatically in the application’s Table property. If the data is sample data, the $SAMPLE_DATA path variable is automatically used in the path. You can also enter an absolute or relative path. Remember that the user must have access to this path.
|
3.
|
Right-click the primary report and select Use as Selection Filter.
|
|
4.
|
Select Run Application from the Application Builder red triangle menu.
|
|
1.
|
|
3.
|
|
4.
|
|
5.
|
Double-click Data Filter Context Box.
|

|
6.
|
|
7.
|
|
10.
|
Click the Application Builder red triangle and select Run Application.
|
|
11.
|
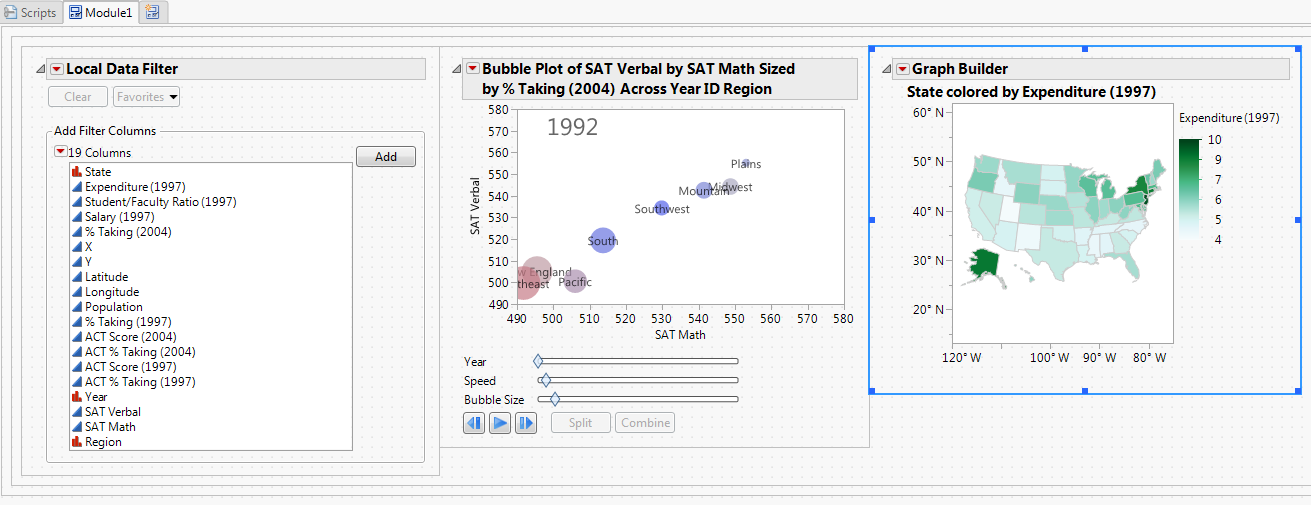
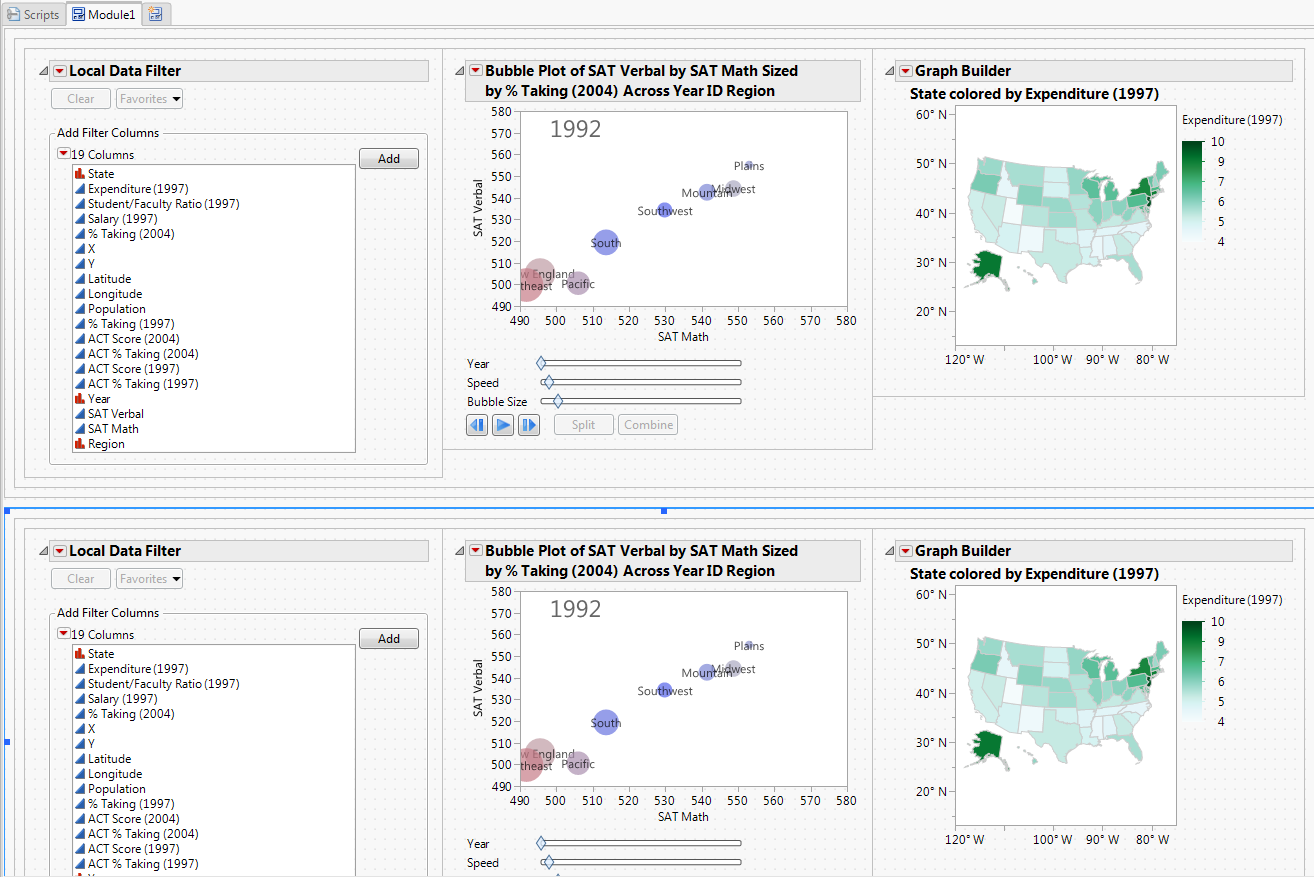
In the Local Data Filter at top, click SAT Math, then click Add. Move the slider to see how it only impacts the reports at top. Do the same for the bottom set of reports.
|
|
3.
|
|
6.
|
Select Run Application from the Application Builder red triangle menu.
|
 to view the date selector window.
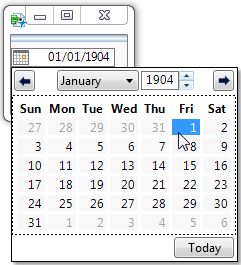
The date selector enables you to select the month and year as well as the date and time for the box.
The Launcher with Report sample application combines a platform launch window with the resulting report. The sample application is displayed when you select File > New > Application.
|
1.
|
You will copy and paste JSL from this sample into your copy. Notice that the Iris.jmp sample data table opens when you open the application.
|
2.
|
|
3.
|
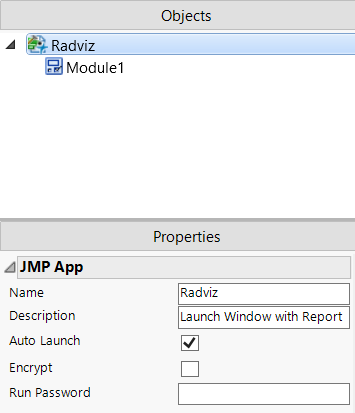
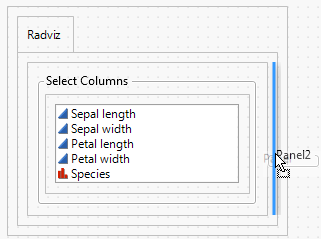
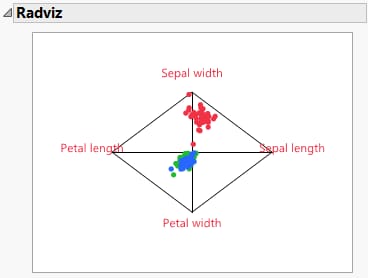
Click the Scripts tab and select Radviz from the Namespace list.
|
One of the scripts that you add to this application refers to dt to identify the data table.
|
5.
|
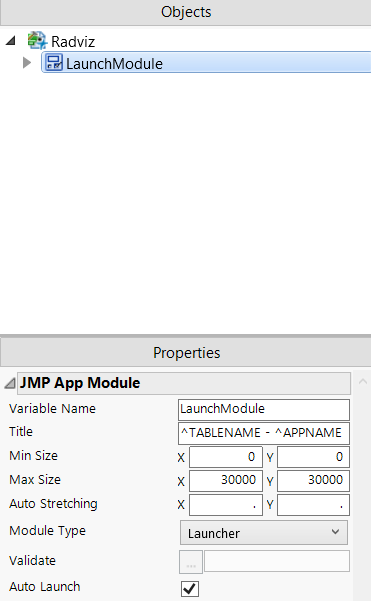
In the Objects pane, select Module1.
|
|
‒
|
|
7.
|
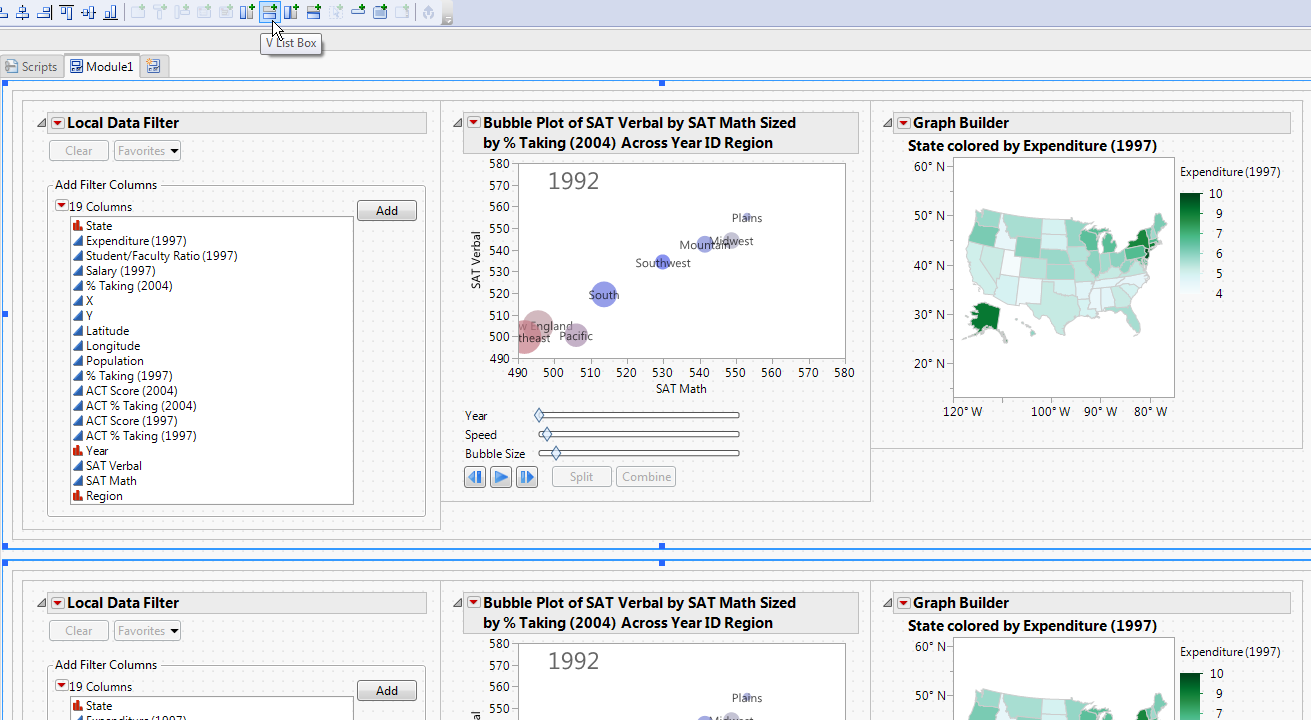
Click the LaunchModule tab and drag a V List Box (under Containers) onto the workspace.
|
|
10.
|

|
11.
|
Because you have made many changes, select File > Save and rename the file. Make sure that .jmpappsource is selected as the file type.
|
|
5.
|
Select DataTable1 in the Objects pane.
|
The current data table, Iris.jmp, appears in the Path box.
|
1.
|
|
11.
|
Right-click and select Move to Corner.
|
|
12.
|
|
5.
|
|
6.
|
|
11.
|
|
5.
|
|
6.
|
|
6.
|
|
1.
|
|
2.
|
|
3.
|
On Windows, select File > Save As, select JMP Application File from the Save as type list, and then click Save.
|
|
4.
|
Distribute the .jmpapp file to users. This file cannot be modified.
|
|
5.
|
Save the .jmpappsource file so you can edit the application and resave it as a JMP application.
|
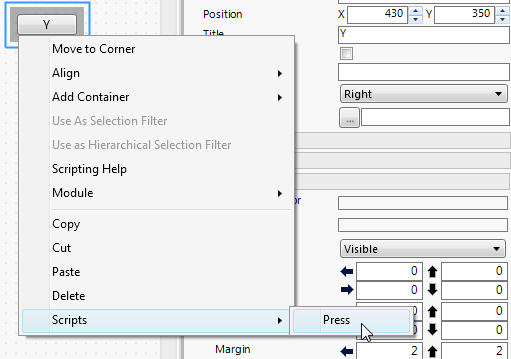
Selecting a script from the Scripts menu adds a placeholder script to the Scripts tab for the selected module. For example, the Press script shown in 图 16.28 adds the following script to the Scripts tab:
Fill in the placeholder script with your own JSL. In the application that you previously created, you named two variables SetY and ColumnList. Rewrite the preceding placeholder script as follows:
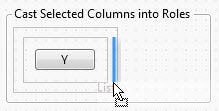
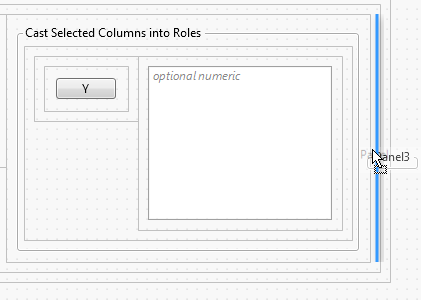
Get Selected is passed to the ColumnList because you gave the Col List Box this variable name (ColumnList) in the object properties. Get Selected returns a list of the selected columns. Append(items) appends the selected columns to YList, the variable assigned to the Col List Box in the Cast Selected Columns into Roles window.