Missing Findings
This report determines whether individuals are missing data for all test codes across all Findings domains, based on data available at each visit number and time point number.
Note: JMP Clinical uses a special protocol for data including non-unique Findings test names. Refer to How does JMP Clinical handle non-unique Findings test names? for more information.
Report Results Description
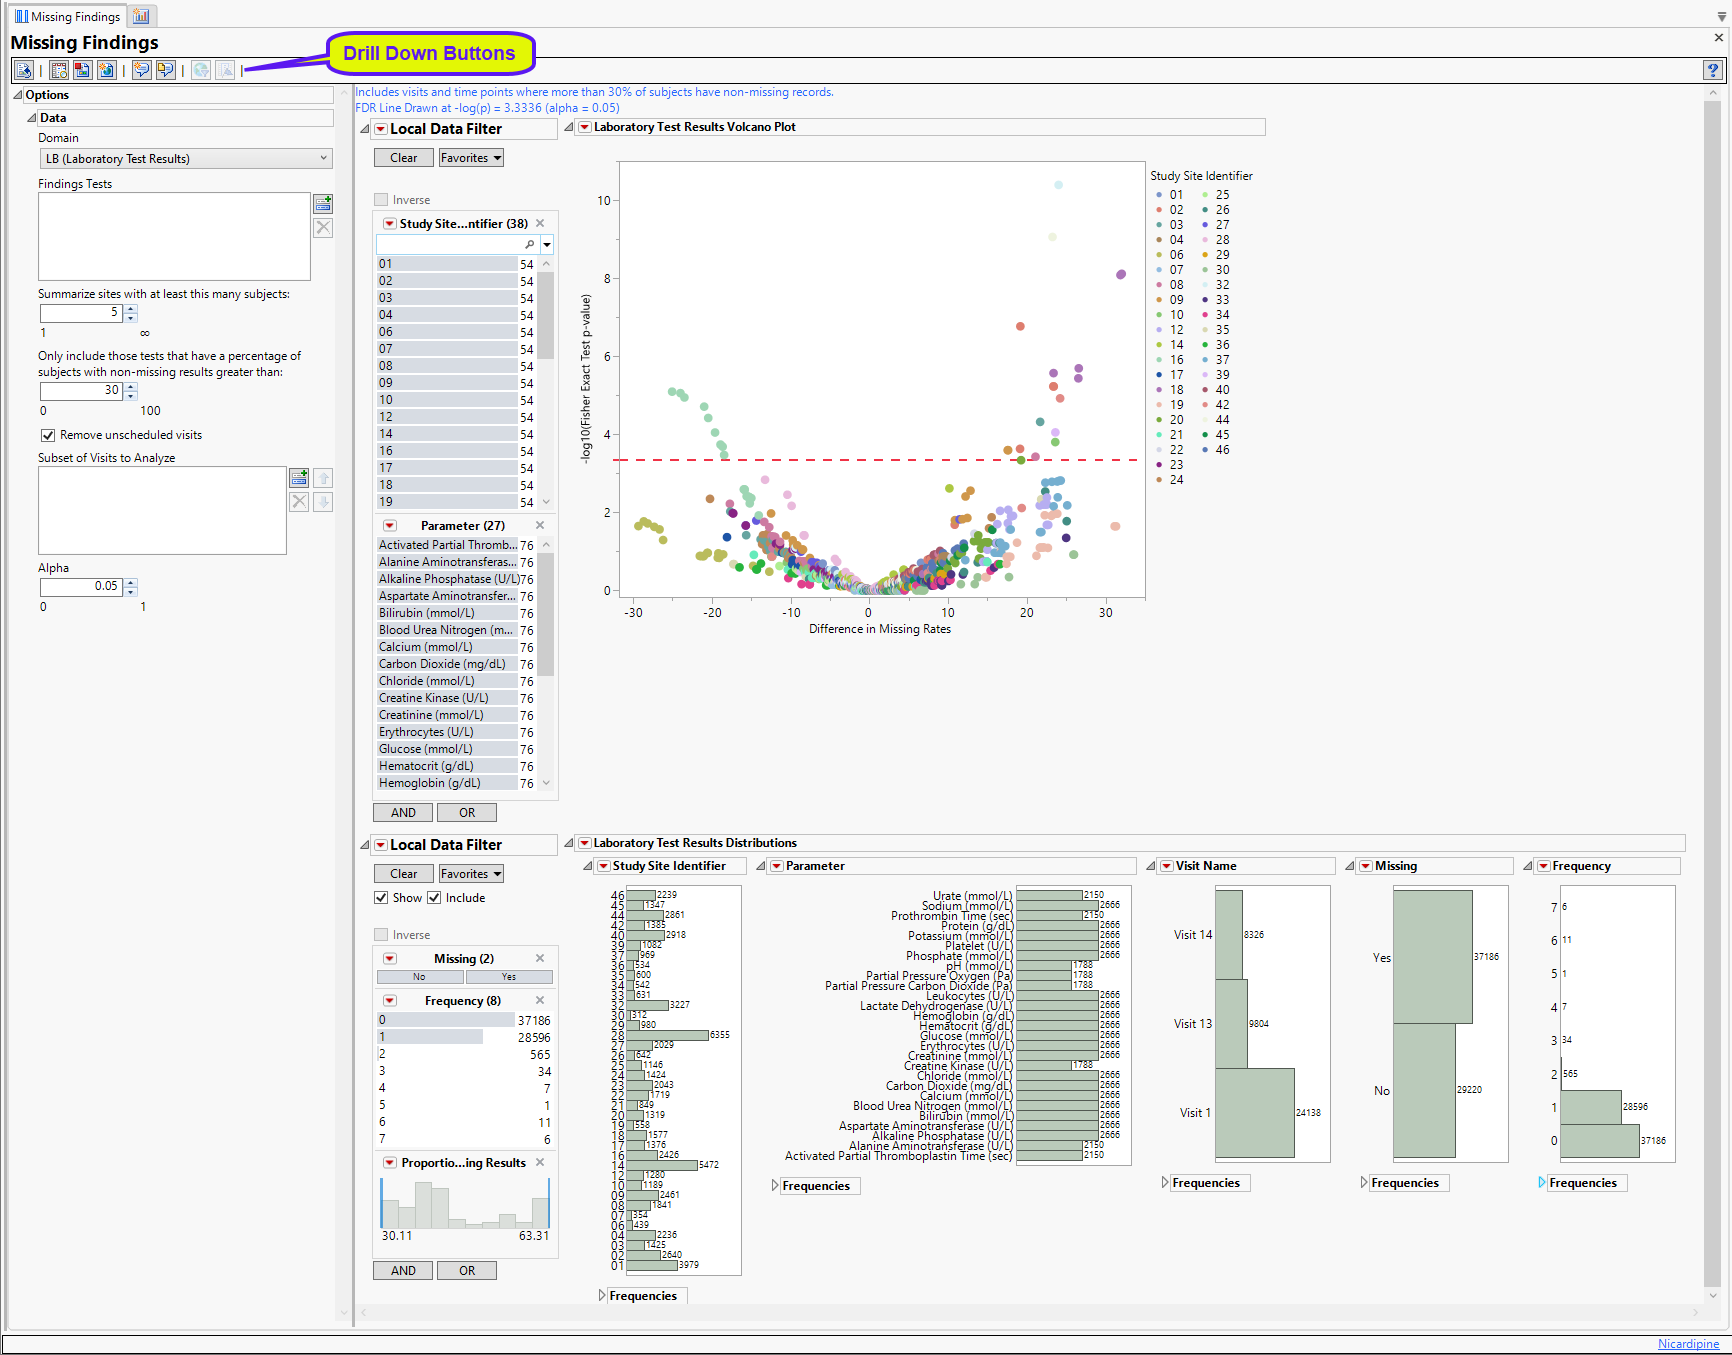
Running Missing Findings for the Nicardipine study with the threshold for subjects expected set to 30% generates the report shown below:
This report contains the following elements:
Missing Findings Volcano Plot
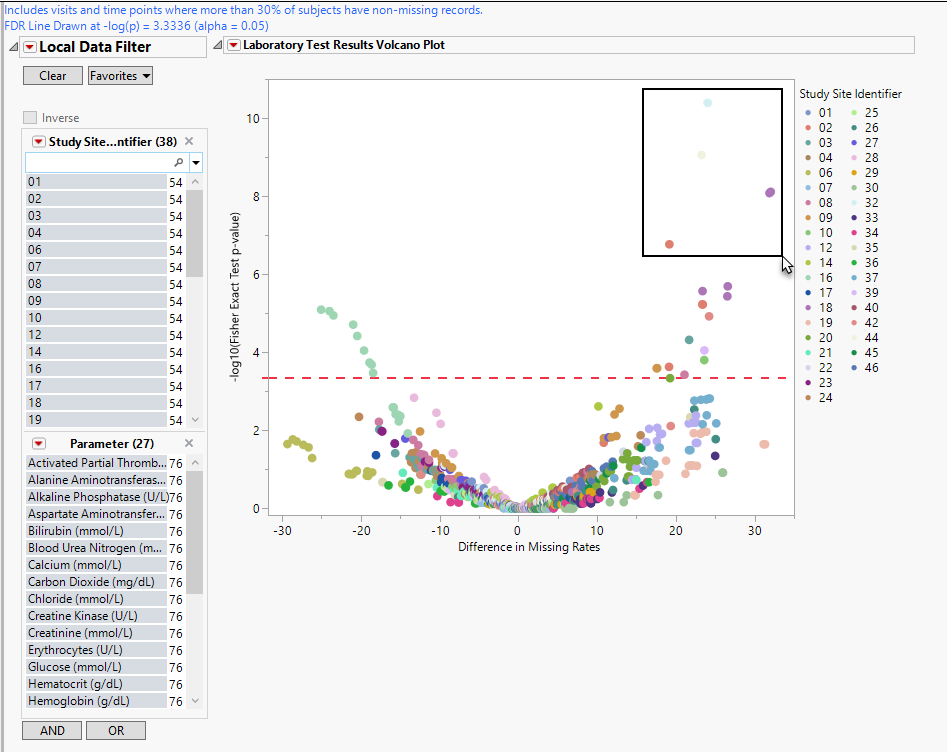
Shows a volcano plot used to determine the deviation of the proportion of missing fundings results at each study site with the overall proportions for the whole study.
| • | One Data Filter. |
Enables you to subset subjects based on study site and/or Test, or additional variables. Refer to Data Filter for more information.
| • | One Volcano Plot. |
The volcano plot is used to determine the deviation of the proportion of missing fundings results at each study site with the overall proportions for the whole study. Each point represents the results for one type of findings test at one site. Those tests/sites plotting close to 0 on both axes show little or no difference from the averages across the entire study. Those tests/sites plotting more distally show greater differences in number of missing findings from the averages.
You can mouse over points of interest to see their labels or select points by dragging a mouse rectangle over them (as shown above). Selected Findings tests are highlighted in other plots and you can also then click on various Drill Down Buttons for further analyses on those specific sites.
See Volcano Plot for more information.
Distributions
This section contains the following elements.
| • | Data Filter: Enables you to filter data based on study site and country. |
| • | Distributions: Displays histograms showing distribution of selected domain findings across study sites, tests, and visit numbers, |
Laboratory Test Results
Displays histograms showing distribution of laboratory test findings across study sites, tests, and visit numbers. In addition, the frequencies of records with either available or missing results are plotted. A frequency of 0 means the result is missing, 1 means that it is present and the test was only performed once at Visit x, 2 means that the test was performed twice at Visit x, and so on.
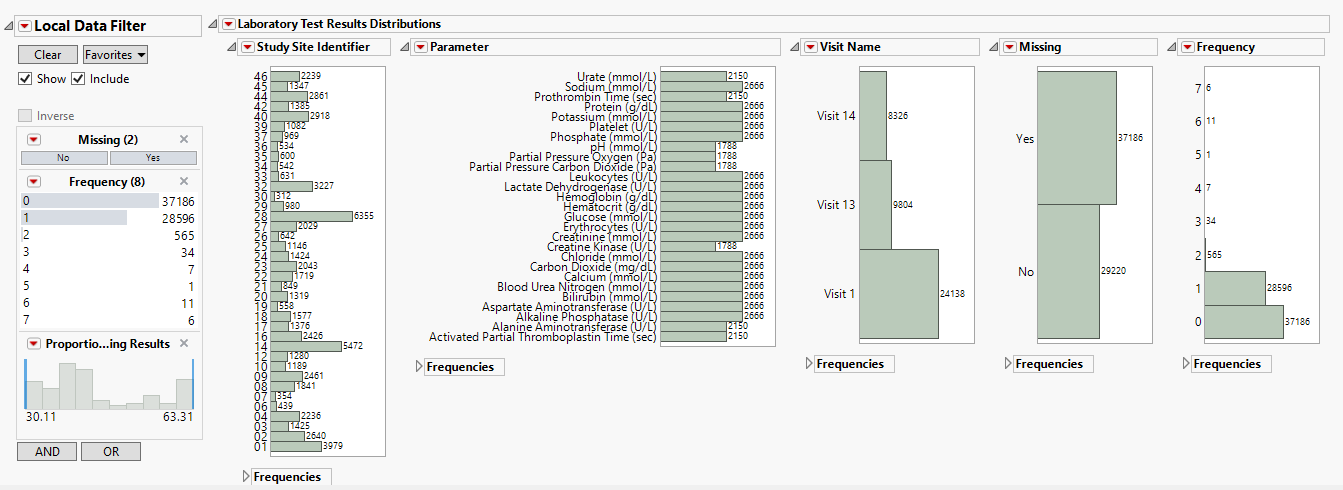
To view missing Lab results, you might need to reduce the threshold percentage of expected subjects and rerun the report.
Electrocardiogram Test Results
Displays histograms showing distribution of ECG findings across study sites, tests, and visit numbers, as well as the frequencies of records with either available or missing results.
To view missing ECG results, you might need to reduce the threshold percentage of expected subjects and rerun the report.
Vital Signs Test Results
Displays histograms showing distribution of vital signs findings across study sites, tests, and visit numbers, as well as the frequencies of records with either available or missing results.
Meeting the threshold percentage of expected subjects is generally not a problem for the VS domain, as these measurements are typically made at every visit.
Options
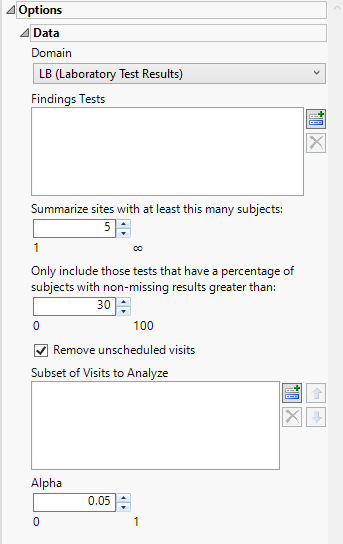
Domain
Use this widget to specify whether to plot the distribution of measurements from either the Electrocardiogram (EG), Laboratory (LB), or Vital Signs (VS) findings domains.
Findings Tests
By default the report is set to analyze all tests from all findings domains. You can opt however, to restrict the search to specific Findings Tests.
Summarize sites with at least this many subjects:
The Summarize sites with at least this many subjects: option enables you to set a minimal threshold for the sites to be analyzed. Only those sites which exceed the specified number of subjects are included. This feature is useful because it enables you to exclude smaller sites, where small differences due to random events are more likely to appear more significant than they truly are. In larger sites, observed differences from expected attendance due to random events are more likely to be significant because any deviations due to random events are less likely to be observed.
Only include those tests that have a percentage of subjects with non-missing results greater than:
By default, findings analyses are conducted assuming that sufficient numbers of subjects have participated to make the results statistically significant. If the percentage of subjects who had the test at a certain visit and time point is low, then the test is removed from the analysis for that visit and time point. The default value for Only include those tests that have a percentage of subjects with non-missing results greater than: is 30%, so if only 20% of the total subjects at Visit x had a certain test performed, then that test at Visit x is removed from the analysis.
Remove unscheduled visits
By default, all patient visits are included in the analysis. The Remove unscheduled visits option enables you to restrict the analysis to scheduled visits only.
Subset of Visits to Analyze
Use the Subset of Visits to Analyze option to select the visits to be included in the analysis.
Alpha
The Alpha option is used to specify the significance level by which to judge the validity of the missing findings data generated by this report. The meaning of alpha depends on the adjustment method that you select. Alpha can be set to any number between 0 and 1, but is most typically set at 0.001, 0.01, 0.05, or 0.10. The higher the alpha, the higher the error rate but also higher the power for detecting significant differences. You will need to decide on the best trade-off for your experiment.
General and Drill Down Buttons
Action buttons, provide you with an easy way to drill down into your data. The following action buttons are generated by this report:
| • | Click  to rerun the report using default settings. to rerun the report using default settings. |
| • | Click  to view the associated data tables. Refer to Show Tables/View Data for more information. to view the associated data tables. Refer to Show Tables/View Data for more information. |
| • | Click  to generate a standardized pdf- or rtf-formatted report containing the plots and charts of selected sections. to generate a standardized pdf- or rtf-formatted report containing the plots and charts of selected sections. |
| • | Click  to generate a JMP Live report. Refer to Create Live Report for more information. to generate a JMP Live report. Refer to Create Live Report for more information. |
| • | Click  to take notes, and store them in a central location. Refer to Add Notes for more information. to take notes, and store them in a central location. Refer to Add Notes for more information. |
| • | Click  to read user-generated notes. Refer to View Notes for more information. to read user-generated notes. Refer to View Notes for more information. |
| • | Click  to open and view the Review Subject Filter. to open and view the Review Subject Filter. |
| • | Click  to specify Derived Population Flags that enable you to divided the subject population into two distinct groups based on whether they meet very specific criteria. to specify Derived Population Flags that enable you to divided the subject population into two distinct groups based on whether they meet very specific criteria. |
Default Settings
Refer to Set Study Preferences for default Subject Level settings.
Methodology
This report determines whether individuals are missing test results based on data available at each visit number and time point number. A test result is identified as “missing” if there is no value in the result column (SDTM: xxSTRESN/xxSTRESN/xxORRES or ADaM: AVAL/AVALC) or if the visit was not performed.
The Subject Visits (SV) domain is required in addtion to the findings domains (LB, EG, VS). SV is used to identify test results that are missing because the visit was not performed. Visits that were not performed because of early discontinuation are not expected. From the SV domain the maximum visit number per subject is obtained and we only expect visits up till the maximum visit number for each subject.
For each test the proportion of “missingness” is calculated for each site (the suspect site, indexed with s) compared to all other sites taken together as a reference (indexed as o) using a Fisher's exact test. FDR p-values are calculated and the reference line is determined as described in How does JMP Clinical calculate the False Discovery Rate (FDR)?.