Set Study Preferences
This study management action enables you to globally set custom study-level attributes, subject-level preferences, analysis preferences for each CDISC class of reports, preferences for calculating study days, as well as preferences for advanced operations. A subset of these study-level preferences are also available on individual reports and are used as initial values for report options, but can be overridden in reports either through review templates or interactively. Some categories in this dialog are only available if they are applicable to the study data.
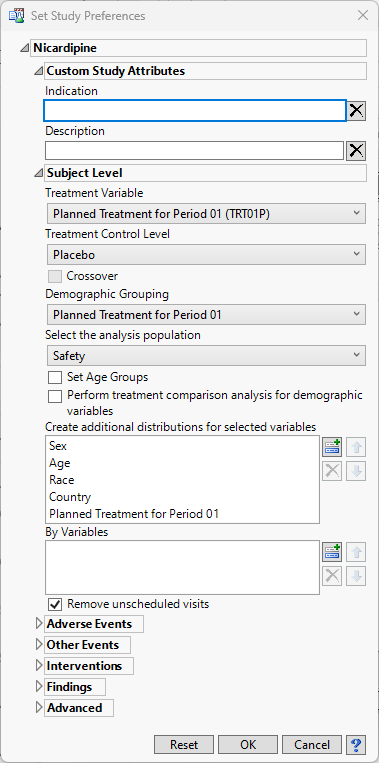
| 8 | Click  to expand each section and specify preferences. to expand each section and specify preferences. |
Note: Some Report categories are surfaced only when the selected study meets the requirements for the reports in that category. As a result, you may not see all of the categories shown below for your study.
Custom Study Attributes
Options shown in this category are determined by the Manage Configurations > System Preferences > Study Management > Custom Study Attributes specification, so this category will be shown only if at least one custom study attribute key has been defined. All studies for a given configuration will display the same set of custom study attributes in the Set Study Preferences dialog. These attributes are displayed on the study information panel of study selector windows, and always appear at the top of the panel.
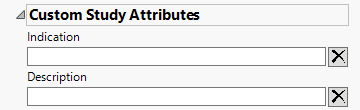
The Indication and Description options are shown by default. This is a place for the user to enter descriptive text regarding the study
Indication
The Indication is simply a short phrase about what the study’s general focus is, or the presumptive use for the drug being investigated.
Description
The Description is longer and more open-ended than the Indication. Use this field to expand on any details about the study that you may feel relevant to reviewers or others users.
Subject Level Preferences
This category includes treatment variable, treatment control value, demographic grouping, and analysis population choices, among others. Some of these preferences are not available on individual reports.
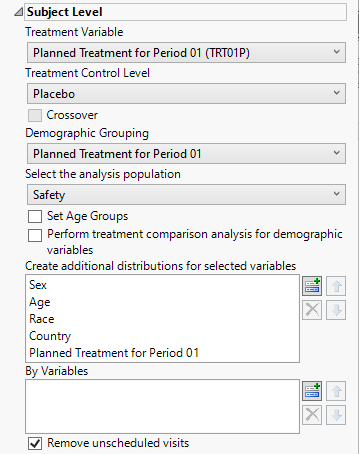
Note: JMP Clinical automatically tries to assign default values for each of the subject level preferences based on flags found in the ADSL, ADDM, or DM (and optionally SUPPDM) data sets as well as prior selections. Use the individual widgets to modify the selections.
Treatment Variable
Use the Treatment Variable widget to specify the variable defining the actual or planned treatment used in the study. Available variables might include either a planned treatment , which is selected when the treatments patients received exactly match what was planned the variable specifying the actual treatmentActual, which is selected when treatment deviates from what was planned. You can also specify any demographic variable from DM and/or ADSL as a surrogate for the treatment variables.
Treatment Control Level
Use this widget to specify the term used in the Treatment variable to specify the study's control. The Treatment Control Level is specified as either “Placebo” or “Pbo”, depending on the value found in your data, by default.
Crossover
Use this widget to indicate that your study contains crossover data.
Demographic Grouping
Use this widget to specify the Demographic Grouping to use for segregating the results of your analysis.
Select the analysis population
This list is populated with available populations that can be defined for the current Study based on flags found in the ADSL, ADDM, or DM (and optionally SUPPDM) data sets. Use the drop-down menu to select the set of individuals to include in the analysis.
Set Age Groups
Check the Set Age Groups check box if you want to group study subjects by age.
Perform treatment comparison analysis for demographic variables.
Check this box to generate the treatment comparisons among the selected demographic variables.
Create additional distributions for selected variables
This option enables you to add or remove demographic variables from DM from the distributions.
| 8 | Click  to open the Add window shown below: to open the Add window shown below: |
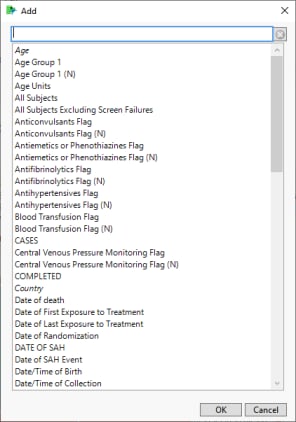
| 8 | Select one or more variables and click . |
| 8 | To remove one or more distributions, highlight the variables to be deleted and click  . . |
| 8 | To rearrange the order of the distributions, select a variable and click either  or or  . . |
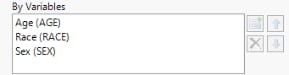
By Variables
BY variables are optional (in most reports) variable specifications whose values define groups of observations, such as hour, month, or year. BY variables can enable analyses to be performed separately on different groups as defined by that variable. Choosing a BY variable such as gender (ADSL variable = SEX), for example, groups the subjects by gender and conducts two separate analyses: one for males and one for females.
Alternatively, specifying a BY variable enables you to animate an image so that you can see how response values change according to some grouping over time.
| 8 | Click  to open the Add window (shown below) that lists each variable contained in domain and SUPPxx (if merged) specific to this report to open the Add window (shown below) that lists each variable contained in domain and SUPPxx (if merged) specific to this report |
Note: In Demographics Distribution only, variables are taken from ADSL, in addition to the report-specific DS and SUPPPDS (if available) data sets.
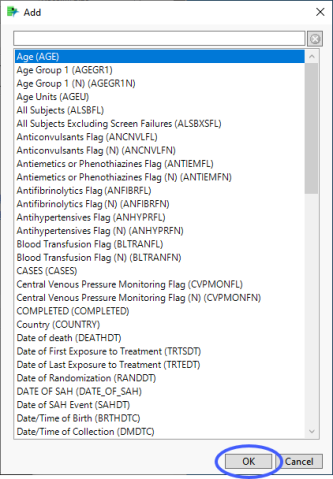
| 8 | Select the variables that you want to include in the analysis and click to add those variables to the text box. |
In this example, AGE, RACE, and SEX were selected and added.
Note: If no BY variables are specified, the analysis is conducted across all the subjects
Remove unscheduled visits
Check this option to remove unscheduled visits from the analysis.
Adverse Events
This category is available if the study contains an adverse events data set.
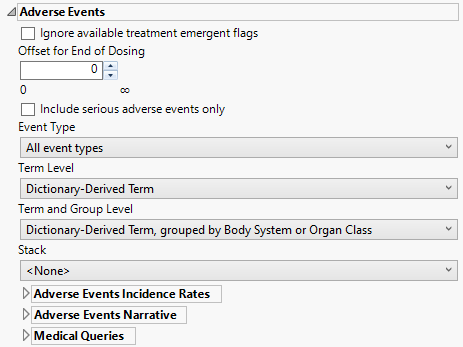
Ignore available treatment emergent flags
If you choose to Ignore available treatment emergent flags, the analysis includes all adverse events that occur on or after day 1 of the study.
Offset for End of Dosing
By default, post-treatment monitoring begins after the patient receives the last treatment. However, you might want to specify an Offset for End of Dosing, increasing the time between the end of dosing and post-treatment monitoring for treatments having an extended half-life.
Include serious adverse events only
Check the Include serious adverse events only check box to include only serious adverse events in the analysis. Serious events are identified by a “Y” value in the expected AESER variable in AE or ADAE.
Event Type
Analysis can consider all events or only those that emerge at specific times before, during, or after the trial period. For example, selecting On treatment events as the Event Type includes only those events that occur on or after the first dose of study drug and at or before the last dose of drug (+ the offset for end of dosing).
Term Level
Use the Term Level widget to specify which level of terms to use as categories.
Term and Group Level
Term and Group Levels are determined by the coding dictionary for the Event or Intervention domain of interest, typically these levels follow the MedDRA dictionary. You must indicate how each adverse event is named and the level at which the event is considered. For example, selecting Reported Term for the Adverse Event, grouped by Body System or Organ Class reports the event specified by the actual event term as reported in the AE domain on the affected organ or body system.
Stack
Use the Stack widget to distinguish different levels within each of the adverse events summarized on the same the bar in the plots.
Adverse Events Incidence Rates
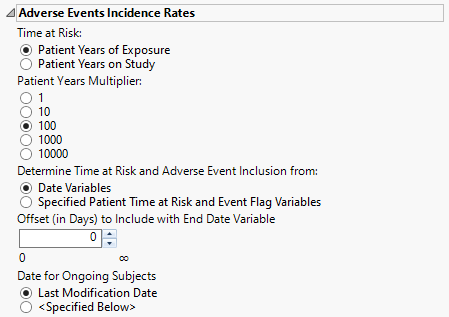
Time at Risk
Use the Time at Risk: widget to specify how to calculate each patient's duration in patient years. If the Time at Risk is calculated from specified patient time at risk and event flag variables, then it is assumed that the variables that you select appropriately match the selection on this dialog for clear communication of results on the report output.
Patient Years Multiplier
The selection of the incidence rate multiplier can be dependent on the number of subjects in a study and the cumulative time on study/treatment. Use the Patient Years Multiplier: widget to select a multiplier for incidence rates for better interpretability and comparison among studies.
Determine Time at Risk and Adverse Event Inclusion from:
Use the Determine Time at Risk and Adverse Event inclusion from: widget to specify whether JMP Clinical should calculate patient years and event inclusion based on study date variables or from derived patient years/time at risk and event inclusion flags.
Offset (in Days) to Include with End Date Variable
Use the Offset (in Days) to Include with End Date Variable widget to specify the number of days after the last date of study or exposure for calculation of patient time at risk and adverse event variable inclusion.
Date for Ongoing Subjects
Use the Date for Ongoing Subjects widget to specify an end date for subjects that are continuing in the clinical trial.
Adverse Events Narrative
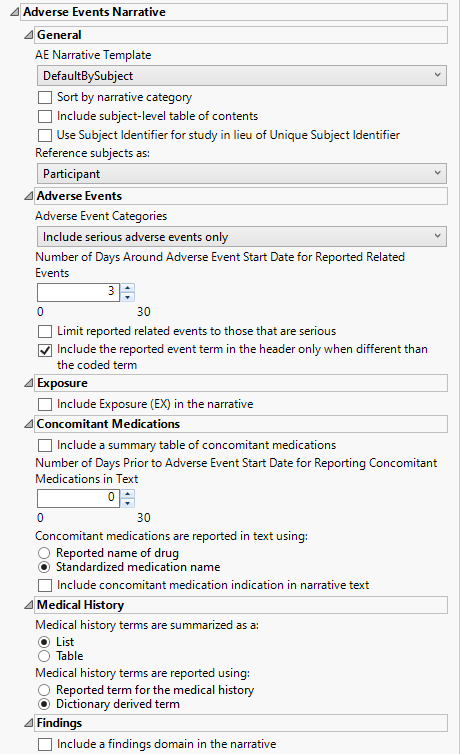
AE Narrative Template
Use the AE Narrative Template option to select the template for the narrative. Templates enable you to customize the narrative in a variety of layouts and/or styles. The templates are read by JMP Clinical at run time and available for selection when creating the final document. The result of this design enables very customizable output that can be altered and/or extended as appropriate for different types of studies or specific regulatory requests.
Sort by narrative category
Check the Sort by narrative category option to sort the narrative by category of fatal adverse events, serious adverse events, adverse events leading to discontinuation, or adverse events of special interest.
Include subject level table of contents
Check this box to Include subject-level table of contents in the narrative.
Use Subject Identifier for study in lieu of Unique Subject Identifier
The Use Subject Identifier for study in lieu of Unique Subject Identifier widget enables you to use the subject identifier for study (SUBJID), if it is available, in lieu of unique subject identifier (USUBJID) in the narrative text. If SUBJID is not available, USUBJID is used as normal.
Reference subjects as:
Use the drop-down menu to specify how you want to refer to the subjects.
Adverse Events Categories
Use the drop-down menu to specify the category of adverse events to include in the narrative. Options include fatal serious adverse events only, serious adverse events only, non-serious adverse events leading to treatment discontinuation, or all adverse events.
Number of Days Around Adverse Event Start Date for Reported Related Events
You might want to include in the narrative additional events that occur at or about the same time as the reported adverse events. Use the Number of days around Adverse Event start date for reported related events option to specify the number of days before and after the onset of the adverse event, within which the additional events are considered. only those events falling within the specified time are included in the narrative.
Limit reported related events to those that are serious
By default, reporting additional adverse events that occur close in time to each summarized event includes all adverse events experienced by the patient. Use the Limit reported related events to those that are serious option limit those events to serious adverse events only.
Include the reported event term in the header only when different than the coded term
Both the coded term for the AE (AEDECOD) and the reported term are included in the headers within the narrative. You can use the Include the reported event term in the header only when different than the coded term to include the reported event term (AETERM) in the header only when different from the coded term (AEDECOD). If they are the same, only the coded term is used.
Include Exposure (EX) in the narrative
You can opt to Include Exposure (EX) in the narrative. The report sums up values of EXDOSE for each day across all records. It does not take into account units such as mg/hr or dosing frequency such as BD or QD. Instead, this report takes the simplest possible approach and assumes that the study sponsors would ultimately report the total dose for a particular study day in EXDOSE. This is also partially why including dosing into the narrative is optional.
All study treatments are to be taken at least once per day
If the study protocol that all study treatments are to be taken at least once each day you should check the All study treatments are to be taken at least once per day option. This is used to calculate drug (including dose interruptions) dosage at the time of the event. Note: This option is checked by default. You should uncheck this box if at least one drug is taken less frequently than once per day. This option is available only when the Include Exposure (EX) in the narrative option is checked.
A 0 dose for placebo or vehicle indicates a dose interuption
The A 0 dose for placebo or vehicle indicates a dose interruption option is used when a dose of 0 for either the placebo or the treatment indicates a dose interruption. This option is specified by default. This option is available only when the Include Exposure (EX) in the narrative option is checked.
Include a summary table of concomitant medications
Use this widget to report information about the concomitant medications study subjects are taking and their possible relationship to observed adverse effects. Note: By default, concomitant medications are not summarized in the narrative. Use the Include a summary table of concomitant medications to include this information.
Use original study days instead of derived values
When you opt to include a summary table of concomitant medications, you can also opt to Use original study days instead of derived values This option is available only when the Include a summary table of concomitant medications option is checked.
Number of Days Prior to Adverse Event Start Date for Reporting Concomitant Medications in Text
The Number of days prior to Adverse Event start date for reporting concomitant medications option enables you to specify the time period on or before treatment that you want to consider. A value of 0 indicates medications that were taken the day of event onset; this value is specified by default. A value of X includes concomitant medications that were taken on the day of the onset of the AE and up to X days prior to AE onset.
Concomitant Medications are reported in text using:
Use the Concomitant medications are reported in text using: option to specify how to report the name of the drug.
Include concomitant medication indication in narrative text
Check this box to include a table concomitant medication indications in the narrative.
Medical history terms are summarized as a:
You can specify whether the Medical history terms are summarized as a table or a list.
Medical history terms are reported using:
Use the Medical history terms are reported using: widget to specify the appropriate medical history terms to be used in narrative text.
Include a findings domain in the narrative
You can opt to Include a findings domain in the narrative.
Include a summary of baseline findings
You might opt to Include summary of baseline findings in the narrative. Note: If the Laboratory Test Results (LB) domain has been specified, only abnormal baseline lab tests are summarized in the body of the narrative. This option is available only when the Include a findings domain in the narrative option is checked.
Include closest on-study findings test dates
Use the Include closest on-study findings test dates: option to specify whether to report results from lab tests taken prior to or on the day of the onset of the adverse event only, results of tests taken subsequent to the onset of the adverse event only, results from tests taken both before and after the onset. You can also choose Neither to include none of the lab results. This option is available only when the Include a findings domain in the narrative option is checked.
Include on-study lab tests where reference range indicator is:
Use the Include on-study lab tests where reference range indicator is: option to specify which findings results to include in the narrative. This option is available only when the Include a findings domain in the narrative option is checked.
Refer to findings tests using
Use the Refer to findings tests using: option to specify the terminology used to refer to the findings results in the narrative. This option is available only when the Include a findings domain in the narrative option is checked.
Medical Queries
Medical Query Type
Use the Medical Query Type widget to specify whether the medical queries are FDA Medical Queries (FMQs) or Standardized MedDRA Queries (SMQs).
Version of FDA Medical Query Files/Version of Standardized Medical Query Files
Use this widget to specify the version of the Medical Query files to use in the analysis. Options include all of the Medical Query files stored in the Medical Query directory specified for your configuration. Refer to General File Paths for information about the location of this directory. This option is dependent on the medical query type specified above.
Display sex specific algorithmic FMQs separately
Use this option to split sex-specific FMQs and display them separately.
Other Events
This category is available if the study contains at least one events data set aside from adverse events.
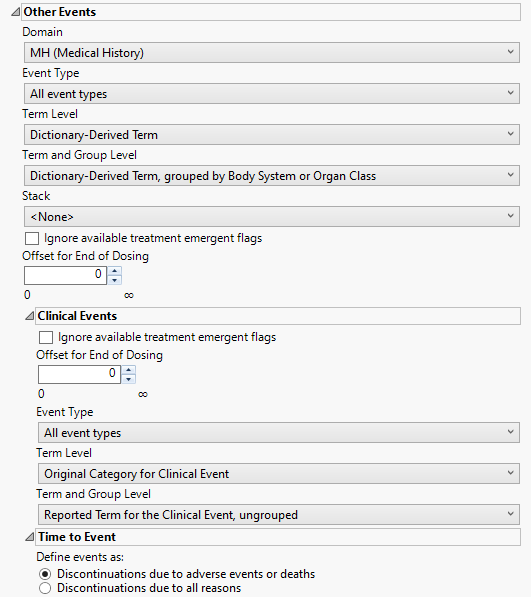
Domain
Use the Domain option to specify whether to analyze either disposition (DS) or medical history (MH) events.
Event Type
Analysis can consider all events or only those that emerge at specific times before, during, or after the trial period. For example, selecting On treatment events as the Event Type includes only those events that occur on or after the first dose of study drug and at or before the last dose of drug (+ the offset for end of dosing).
Term Level
Use the Term Level widget to specify which level of terms to use as categories.
Term and Group Level
Term and Group Levels are determined by the coding dictionary for the Event or Intervention domain of interest, typically these levels follow the MedDRA dictionary. You must indicate how each adverse event is named and the level at which the event is considered. For example, selecting Reported Term for the Adverse Event, grouped by Body System or Organ Class reports the event specified by the actual event term as reported in the AE domain on the affected organ or body system.
Stack
Use the Stack widget to distinguish different levels within each of the events summarized on the same the bar in the plots.
Ignore available treatment emergent flags
If you choose to Ignore available treatment emergent flags, the analysis includes all events that occur on or after day 1 of the study.
Offset for End of Dosing
By default, post-treatment monitoring begins after the patient receives the last treatment. However, you might want to specify an Offset for End of Dosing, increasing the time between the end of dosing and post-treatment monitoring for treatments having an extended half-life.
Clinical Events
This category is available within Other Events if the study contains a clinical events data set.
Ignore available treatment emergent flags
If you choose to Ignore available treatment emergent flags, the analysis includes all adverse events that occur on or after day 1 of the study.
Offset for End of Dosing
By default, post-treatment monitoring begins after the patient receives the last treatment. However, you might want to specify an Offset for End of Dosing, increasing the time between the end of dosing and post-treatment monitoring for treatments having an extended half-life.
Event Type
Analysis can consider all events or only those that emerge at specific times before, during, or after the trial period. For example, selecting On treatment events as the Event Type includes only those events that occur on or after the first dose of study drug and at or before the last dose of drug (+ the offset for end of dosing).
Term Level
Use the Term Level widget to specify which level of terms to use as categories.
Term and Group Level
Term and Group Levels are determined by the coding dictionary for the Event or Intervention domain of interest, typically these levels follow the MedDRA dictionary. You must indicate how each adverse event is named and the level at which the event is considered.
Time to Event
Define events as:
Use this widget to specify those discontinuations that are to be considered as events. This option is used for records where the value in DSCAT is Disposition Event.and the last one (sorting by DSSTDTC) is selected (unless a where statement is defined to choose the records, 1 per person). Refer to Define events as: for more information.
Interventions
This category is available if the study contains at least one interventions data set.
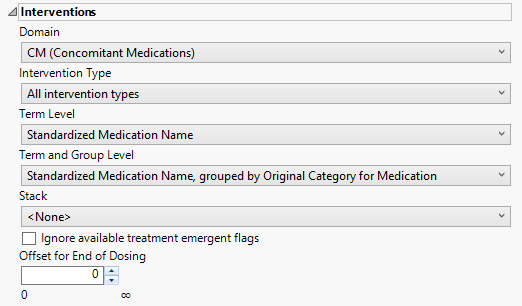
Domain
Use the Domain option to specify whether to analyze either concomitant medication (CM) or exposure (EX) interventions.
Intervention Type
Analysis can consider all events or only those that emerge at specific times before, during, or after the trial period. For example, selecting On treatment interventions as the Intervention Type includes only those interventions that occur on or after the first dose of study drug and at or before the last dose of drug (+ the offset for end of dosing).
Term Level
Use the Term Level widget to specify which level of terms to use as categories.
Term and Group Level
Term and Group Levels are chosen from available variables in the Intervention domain of interest. You must indicate how each intervention is named and the level at which the intervention is considered. For example, selecting Standardized Medication Name, grouped by Category for Medication as the Term Level and Group Level, respectively, reports the intervention within the Medication Category as provided in the CM domain.
Stack
Use the Stack widget to distinguish different levels within each of the events summarized on the same the bar in the plots.
Ignore available treatment emergent flags
If you choose to Ignore available treatment emergent flags, the analysis includes all interventions that occur on or after day 1 of the study.
Offset for End of Dosing
By default, post-treatment monitoring begins after the patient receives the last treatment. However, you might want to specify an Offset for End of Dosing, increasing the time between the end of dosing and post-treatment monitoring for treatments having an extended half-life.
Findings
This category is available if the study contains at least one findings data set.
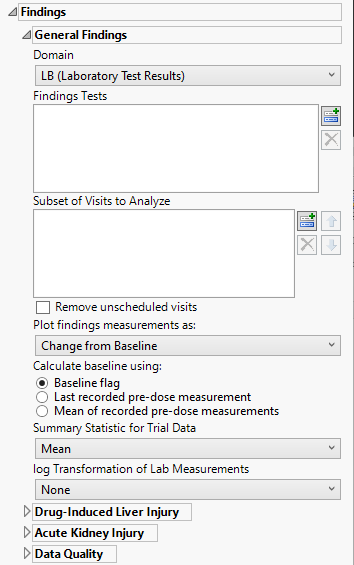
Domain
Use the Findings Domain to Analyze option to specify whether to plot the distribution of measurements from either the Electrocardiogram (EG), Laboratory (LB), or Vital Signs (VS) findings domains.
Findings Tests
Use this widget to select specific Findings tests.
| 8 | Click to open the Add window (shown below) that lists available test names (shown below). |
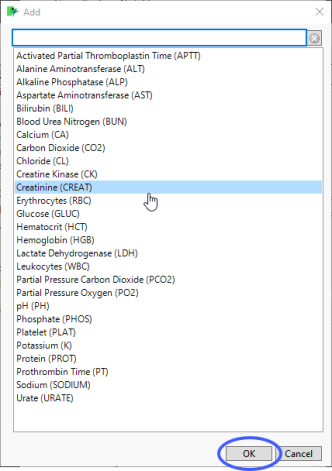
| 8 | Select the desired test(s) and click to add them to the text box. |
Subset of Visits to Analyze
Use the Subset of Visits to Analyze option to select the visits to be included in the analysis.
Remove unscheduled visits
Check this option to remove unscheduled visits from the analysis. For a given Findings domain, any record where the VISIT variable (if it exists) contains unscheduled (case insensitive) is removed from the analysis.
Plot findings measurements as:
Use the Plot findings measurements as: widget to select the type of findings measurement values to plot.
Calculate baseline as:
Use this widget to specify how the baseline findings measurements should be calculated. Refer to Calculate baseline using: for more information.
Summary Statistic for Trial Data
Select the statistic used to summarize the data from the trial period. Refer to Summary Statistic for Trial Data for information about each of the options.
log Transformation of Lab Measurements
Use the drop-down menu to select the transformation to be applied to the baseline and experimental measurements. Refer to log Transformation of Findings Measurements for more information about available transformations.
Drug-Induced Liver Injury
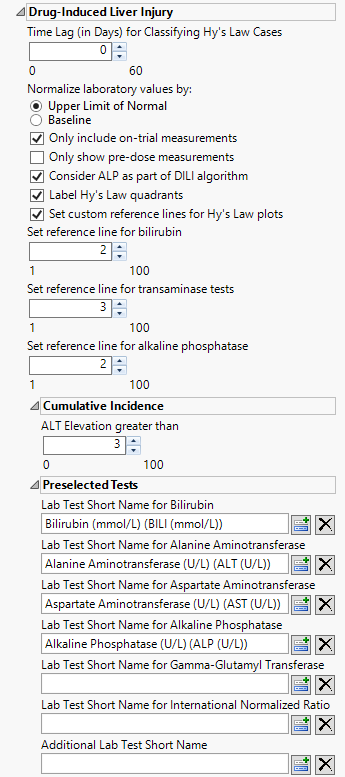
Time Lag (in Days) for Classifying Hy's Law Cases
Use the widget to specify a lag time for classifying a subject as a Hy's Law case. Refer to Time Lag (in Days) for Classifying Hy’s Law Cases for more information.
Normalize laboratory values by:
Use this widget to select the reference values to use for performing Hy's Law Screening. Refer to Normalize laboratory values by: for more information.
Only include on-trial measurements
Use this option to filter the laboratory domain records to consider only measurements that are taken after Study Day 1 and are not flagged as baseline. This option is applicable only when you normalize laboratory values by the Upper Limit of Normal. This option does not apply when normalizing by Baseline. Refer to Only include on-trial measurements for more information.
Only show predose measurements
Check this option to exclude all on-trial measurements from the analysis. This option enables you to observe all subjects at baseline. See Only show predose measurements for more information
Consider ALP as part of the DILI algorithm:
Use this option to include the ALP test measurements when determining whether a patient meets Hy's Law criteria.to determine possible Hy's law cases. See Consider ALP as part of the DILI algorithm for more information.
Label Hy's Law quadrants
Check the box to annotate the plot of Bilirubin against Alanine Aminotransferase with terms relating to Hy’s Law. Refer to Lab Test Short Name for Alkaline Phosphatase for more information.
Set custom reference lines for Hy's Law plots
Check this option to use a custom threshold for drawing reference lines for Bilirubin (on the X axis) and for Alanine Aminotransferase (on the Y axis) of the plot. When this box is checked, you can change the values that you want to draw reference lines using the Set reference line for bilirubin and Set reference line for transaminase tests options. If left unchecked, traditional Hy’s Law reference lines (twice the upper limit of normal (ULN) for bilirubin and three times the ULN for alanine aminotransferase) are drawn.
Set reference line for bilirubin
Use this widget to specify a custom reference line for the bilirubin test (BILI) to be drawn on the Hy’s Law plot.
Set reference line for transaminase tests
Use this widget to specify a custom reference line for the alanine transaminase test (ALT) and aspartate transaminase test (AST) to be drawn on the Hy’s Law plot. This same custom threshold is used for both ALT and AST.
Set reference line for alkaline phosphatase
Use this widget to specify a custom reference line for the alkaline phosphatase test (ALP) to be drawn on the Hy’s Law plot.
ALT Elevation greater than
By default, ALT levels equal to or greater 3*ULN are considered as events for the cummulative incidence screen. ALT levels below this values are not. You can change the value of this cutoff using the ALT Elevation greater than option.
Lab Test Short Name for Bilirubin
Use this text field to specify the Test Short Name (LBTESTCD) value that corresponds to the bilirubin test. By default, attempts to detect common recommended values for the bilirubin test. If it finds one, the report automatically enters it in the text box. If an alternative designation is used in your study, the field is left blank and you must specify the designation. Refer to Lab Test Short Name for Bilirubin for more information.
| 8 | Click to open the Add window (shown below) that that lists available test names (shown below). |
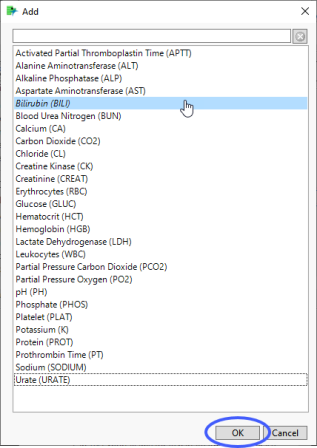
| 8 | Select the short name for bilirubin and click to add it to the text box. |
Lab Test Short Name for Alanine Aminotransferase
Use this widget to specify the Test Short Name (LBTESTCD) value that corresponds to the alanine aminotransferase test, as described for bilirubin. Refer to Lab Test Short Name for Alanine Aminotransferase for more information.
Lab Test Short Name for Aspartate Aminotransferase
Use this widget to specify the Test Short Name (LBTESTCD) value that corresponds to the aspartate aminotransferase test, as described for bilirubin. Refer to Lab Test Short Name for Aspartate Aminotransferase for more information.
Lab Test Short Name for Alkaline Phosphatase
Use this text field to specify the Test Short Name (LBTESTCD) value that corresponds to the alkaline phosphatase test, as described for bilirubin. Refer to Lab Test Short Name for Alkaline Phosphatase for more information.
Lab Test Short Name for Gamma-Glutamyl Transferase
Use this text field to specify the Test Short Name (LBTESTCD) value that corresponds to the gamma-glutamyl test, as described for bilirubin. Refer to Lab Test Short Name for Gamma-Glutamyl Transferase for more information.
Lab Test Short Name for International Normalized Ratio
Use this text field to specify the Test Short Name (LBTESTCD) value that corresponds to the INR test, as described for bilirubin. Refer to Lab Test Short Name for International Normalized Ratio for more information.
Additional Lab Test Short Name
Use this text field to specify the Test Short Name (LBTESTCD) value that corresponds toan additional test that ou want to include, as described for bilirubin. Refer to Additional Lab Test Short Name for more information.
Acute Kidney Injury
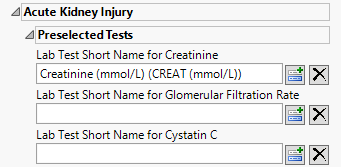
Lab Test Short Name for Creatinine
Use this text field to specify the Test Short Name (LBTESTCD) value that corresponds to the creatinine test, as described for bilirubin. Refer to Lab Test Short Name for Creatinine for more information.
Lab Test Short Name for Glomeruler Filtration Rate
Use this text field to specify the Test Short Name (LBTESTCD) value that corresponds to the glomerular filtration rate test, as described for bilirubin. Refer to Lab Test Short Name for Glomerular Filtration Rate for more information.
Lab Test Short Name for Cystatin C
Use this text field to specify the Test Short Name (LBTESTCD) value that corresponds to the Cystatin C test, as described for bilirubin. Refer to Lab Test Short Name for Cystatin C for more information.
Data Quality
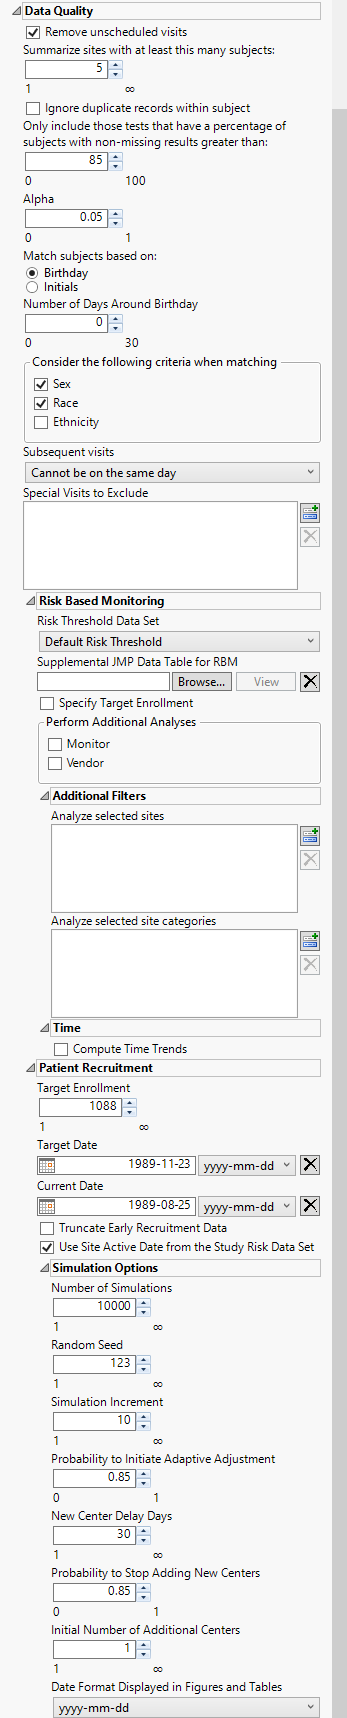
Remove unscheduled visits
Check this option to remove unscheduled visits from the analysis. For a given Findings domain, any record where the VISIT variable (if it exists) contains unscheduled (case insensitive) is removed from the analysis. Refer to Remove unscheduled visits for more information.
Summarize site with at least this many subjects
Specify the number of subjects a site must have in the selected population in order to include it in the summary. Refer to Summarize sites with at least this many subjects: for more information.
Ignore duplicate records within subject
Check the Ignore duplicate records within subject check box to delete multiple occurrences of the same subject within each set of duplicate records. If a set of duplicates is based entirely on one subject, these sets are removed.
Only include those tests that have a percentage of subjects with non-missing results greater than:
Use the Only include those tests that have a percentage of subjects with non-missing results greater than: widget to specify a threshold level for participating in a test. Tests in which the percentage of subjects receiving that test falls below the set threshold are excluded from the analysis. This option is useful from excluding tests that are conducted only rarely from the analysis. If a test is rare or unexpected at a visit or time point, this option prevents it showing up as missing for the populations of subjects under analysis.
Alpha
Alpha is the false positive or false discovery rate that you desire across all of the hypothesis tests. Alpha must be a real number between 0 and 1; it is typically set at either 0.01, 0.05 or 0.10.
Match subjects based on:
Select either Birthday or Initials to use as criteria for matching subjects. Refer to Match subjects based on: for more information.
Number of Days Around Birthday
Use this widget to specify the number of days around a given birthday to consider as a match. Refer to Number of Days around Birthday for more information.
Consider the following criteria when matching
Use this widget to specify the demographic variable(s) to consider as criteria when determining matching. Options include Sex, Race, and Ethnicity.
Subsequent Visits
Use the Subsequent visits option to specify whether visits can occur on the same day.
Special Visits to Exclude
Use the Special visits to exclude option to exclude those visits which, based on the numbering scheme, will trigger an alert. This is useful for special visit codes such as for unscheduled or early discontinuation visits, which can be coded as 98 or 99, respectively.
Risk Threshold Data Set
The risk threshold data set is used as a reference to identify and label levels of risk in the Study. Use the drop down menu to select the risk threshold data set to use in the analysis. Refer to Risk Threshold Data TableSet for more information about risk threshold data sets.
Supplemental JMP Data Table for RBM
Use this option to specify a data set containing supplemental data to include in the RBM analysis. Refer to Supplemental JMP Data Table for RBM for more information
Specify Target Enrollment
Check Specify Target Enrollment box to specify a target enrollment rate.
Target Enrollment of Subjects per Week per Site
Specify the number of subjects enrolled per week per site. Refer to Target Enrollment of Subjects per Week per Site for more information. Note: This option is available only when the Specify Target Enrollment box is checked.
Monitor
Check the Monitor box to perform additional analyses at the monitor level.
Vendor
Check the Vendor box to perform additional analyses at the vendor level.
Analyze selected sites
The Analyze Selected Sites option enables you to limit the analysis to a selected subset of study sites. Risk indicators are then calculated for those sites only.
Analyze selected site categories
The Analyze selected site categories option enables you to limit the analysis to a selected subset of site categories that are specified in Site Details for Risk Based Monitoring Report.
Compute Time Trends
Use the Compute Time Trends option to compute risk indicators over evenly-spaced chronological times. This can be helpful in detecting trends in the indicators and forecasting future values.
Target Enrollment
The Target Enrollment option enables you to specify the number of subjects needed across all study sites for the study. This number needs to be greater than the current total enrolled subjects.
Target Date
The Target Date option enables you to specify the anticipated start date for the study. The date needs to be later than the Current Date.
Current Date
The Current Date option enables you to specify the current date. By default, this is the randomization date of the last enrolled subject.
Truncate Early Recruitment Data
The Truncate Early Recruitment Data option enables you to choose a start date to truncate early recruitment data.
Truncation Date
The Truncation Date option enables you to specify the start date for truncating early recruitment data. This option is available only when the Truncate Early Recruitment Data option is checked. The date needs to be later than the recruitment start date, and earlier than the Current Date.
Use Site Active Date from the Study Risk Data Set
Check the Use Site Active Date from the Study Risk Data Set option to use the site active date from the Study Risk Data Set from the Update Study Risk Data Set report. If this box is not checked, the minimum of ADSL.RANDDT (or DM.RFSTDTC, if RANDDT not available) within the site is used to determine when a site became active. Study day within the site is calculated relative to the site active date.
Number of Simulations
The Number of Simulations option enables you to specify the number of simulations to be performed on the Poisson-Gamma modeling that are used to predict future enrollment. The default value is 10000. Smaller values may decrease the accuracy of the estimated recruitment date; while larger values may increase the computational time.
Random Seed
The Seed Number option enables you to specify a value used to generate reproducible random samples from specified distributions.
Simulation Increment
The Simulation Increment option is used to specify the amount of increment in enrollment when simulating the remaining time from current enrollment up to total enrollment. The default value is 10. If the total remaining number of patients to recruit is less than 50, the Simulation Increment parameter will be automatically adjusted to a smaller number.
Probability to Initiate Adaptive Adjustment
The Probability to Initiate Adaptive Adjustment option is used to specify the probability threshold for meeting the deadline before initiating adaptive adjustment. The default value is 0.85.
New Center Delay Days
The New Center Delay Days option is used to specify the number of days recruitment is delayed at the new centers. This value is taken into account when predicting the time remaining. The default number is 30.
Probability to Stop Adding New Centers
The Probability to Stop Adding New Centers option is used to specify the minimum probability threshold for meeting the target recruitment by the deadline. The default value is 0.85.
Initial Number of Additional Centers
The Initial Number of Additional Centers option is used to specify the initial number of new centers to be added to increase enrollment rate. The default value is 1.
Date Format Displayed in Figures and Tables
The Date Format Displayed in Figures and Tables option is used to specify the format of the date and time in figures and tables.
Oncology
This category is available if the study contains at least one oncology-related data set (e.g., RS, TR, TS, TU).
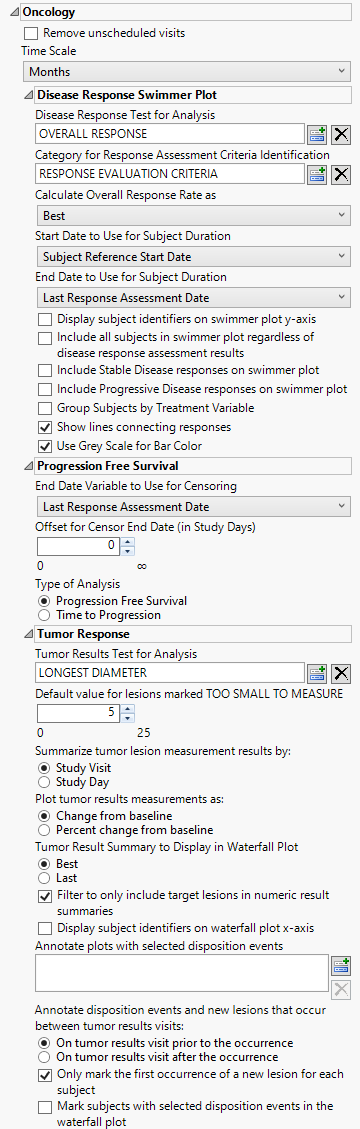
Remove unscheduled visits
Check this option to remove unscheduled visits from the analysis. For a given Findings domain, any record where the VISIT variable (if it exists) contains unscheduled (case insensitive) is removed from the analysis. Refer to Remove unscheduled visits for more information.
Time Scale
Use this widget to specify the time scale to use for times. Options include Days, Weeks, Months, and Years. Refer to Time Scale for more information.
Disease Response Swimmer Plot
Disease Response Test for Analysis
Use the Disease Response Test for Analysis widget to select the relevant test code (RSTESTCD) whose results (RSSTRESC) contain values for tracking response assessment of Complete Response, Partial Response, Progressive Disease, or Stable Disease across study visits/time points. By default, if this option is left blank the report will attempt to find and use an RSTEST value of OVERALL RESPONSE (case insensitive).
Category for Response Assessment Criteria Identification
Use the Category for Response Assessment Criteria Identification widget to filter/select to the specific response assessment criteria value to use for showing response assessment in the resulting swimmer plot and table. If this field is left blank or your data does not contain the expected variable RSCAT with valid values of criteria identification, all records will be considered for the given selected test or algorithmically for any test named OVERALL RESPONSE.
Calculate Overall Response Rate as:
Use the Calculate Overall Response Rate as to select the option for which to calculate Response Rate Summaries displayed in the table for each subject. Choose Best to select a representative response that indicates the best response a patient had recorded at any time during response assessment using preferential logic of CR, PR, SD, PD order. Choose Last to take the last response assessment recorded for each subject. Note: If multiple responses are observed at the final visit, the best among them is reported.
Start Date to Use for Subject Duration / End Date to Use for Subject Duration
You must specify the start and end dates for collecting data to assess response of patients to the treatments. The Start Date to Use for Subject Durationand End Date to Use for Subject Duration widgets are used to select which variable date reference from the demography domain to use for calculating the response duration.
Display subject identifiers on swimmer plot y-axis
By default, subject identifiers are not included on the swimmer plots. Click the Display subject identifiers on swimmer plot y-axis box to display the subject identifiers on the y-axes of the plots.
Include all subjects in swimmer plot regardless of disease response assessment results
You can include all subjects, regardless of disease response by checking the Include all subjects in swimmer plot regardless of disease response assessment results widget.
Include Stable Disease responses on swimmer plot
By default, stable disease responses are not included on the swimmer plots. You can include these responses by checking the Include Stable Disease responses on swimmer plot widget.
Include Progressive Disease responses on swimmer plot
By default, progressive disease responses are not included on the swimmer plots. You can include these responses by checking the Include Progressive Disease responses on swimmer plot widget.
Group Subjects by Treatment Variable
Swimmer plots are presented in order of longest to shortest time subjects have participated in the study, irrespective of treatment. The Group Subjects by Treatment Variable option enables you to group and color-code subjects by treatment.
Show lines connecting responses
Checking the Show lines connecting the responses widget connects the observations with lines.
Use Grey Scale for Bar Color
You can opt to display the bars and response markers on the swimmer plot in grey scale by checking the Use Grey Scale for Bar Color widget.
Progression Free Survival
End Date Variable to Use for Censoring
For patients who survive progression-free beyond the end of the study, the ultimate progression-free survival values for these individuals are unknown. All that can be said is that progression-free survival exceeds the period of the study; these data are considered censored. For these cases, you must specify the end date for collecting data to assess progression. The End Date Variable to Use for Censoring widget is used to select which variable date reference from the demography domain to use for calculating the censored disease progression values. Patients who progress after this date are not considered as progressing. The Last Response Assessment Date is chosen by default.
Offset for Censor End Date (in Study Days)
The Offset for Censor End Date (in Study Days) option enables you to specify a minimum time interval following censor end date that can be used to determine whether progression has occurred. Patient who progress within that threshold are considered to have progressed whereas patients who progress after the specified threshold are not.
Type of Analysis
The Type of Analysis widget enables you to specify whether you want to measure Progression Free Survival or Time to Progression. Progression free survival measures the time from patient randomization to either tumor progression or death. Time to progression censors death and only considers objective tumor progression. A note is added to the top of the report indication which type of analysis has been selected.
Tumer Response
Tumor Results Test for Analysis
Use Tumor Results Test for Analysis widget to select the test to be used both for creating the summary measurement value to plot by time in the spider plot and to summarize in the waterfall plot where each subject is represented with a bar whose height is determined by the calculated Best or Last value.
Default value for lesions marked TOO SMALL TO MEASURE
Use the Default value for lesions marked TOO SMALL TO MEASURE widget to specify a value to replace when TRSTRESN is missing and the TRSTRESC result has a value of TOO SMALL TO MEASURE. Per RECIST guidelines, this should be a value of 5mm.
Summarize tumor lesion measurement results by:
Use the Summarize tumor lesion measurement results by: widget to select either Study Visit or Study Day as the time period to summarize the results by. Selecting Study Visit uses VISIT/VISITNUM and potentially Time Point (TRTPT if detected) for defining groups of lesions that should be aggregated to create a measurement for tumor burden. Alternatively, selecting Study Day sums lesions based on the date of the test (transformed into days relative to study start. Note: This option is still used to define unique measurements by visit/day and will average measurements if there are multiple results on the same visit/day if the test selected or chosen is an already summed representation of tumor lesion burden.
Plot tumor results measurements as:
Use the Plot tumor results measurements as: widget to select the type of findings measurement values to plot. Selecting Change from baseline plots the change from the findings baseline measurements (determined by the xxBLFL variable or by Study Day less than 1). Selecting Percent Change from Baseline plots the percent change from the findings baseline measurements. Percent Change from Baseline is specified by default.
Tumor Result Summary to Display in Waterfall Plot
Use the Tumor Result Summary to Display in Waterfall Plot widget to select the statistic by which to summarize the data from the trial period. (The mean is always used to summarize data from the baseline period.) Best refers to best overall response. Last refers to the last observed value.
Filter to only include target lesions in numeric result summaries
When the Filter to only include Target Lesions in numeric result summaries widget is checked, the report algorithm attempts to find target lesion information based on values in the following SDTM identifying variables (in order of preference for detection): TRGRPID, TRCAT, TUSTRESC or TUORRES (via unique TRLNKID to TULNKID). If the values of the determined variable contains TARGET and does not contain values such as NEW, NON-TARGET, or NOT TARGET, then these records are only used for evaluating tumor result measurements for plots. When this option is unchecked, any record for the selected or determined TRTEST for analysis that has a numeric result (TRSTRESN) is included in the calculation and summary plots.
Display Subject identifiers on waterfall plot x-axis
By default, subject identifiers are not included on the waterfall plots. Click the Display subject identifiers on waterfall plot x-axis box to display the subject identifiers on the x-axes of the plots.
Annotate plots with selected disposition events
The Annotate Plots with Selected Disposition Events option enables you to annotate the output plots with selected disposition events. This feature enables you to quickly identify subjects experiencing those events and when during the study the event occurred.
Annotate disposition events and new lesions that occur between tumor results visits
Use the Annotate disposition events and new lesions that occur between tumor results visits: option to annotate visits (in the spider (line trend) plot) before or after the occurrence of a new lesion or disposition event when the study day (determined by TRDTC or DSDTC for new lesions or disposition events respectively) is between tumor lesion summary measurement results.
Only mark the first occurrence of a new lesion for each subject
Use the Only mark the first occurrence of a new lesion for each subject to annotate the first occurrence of any new lesion only per subject in the spider (line trend) plot. New lesions are marked with an asterisk at the visit where it occurred or anchored to a visit value based on the comparison of study day and the preference set on the report options to annotate either prior/after the occurrence if the new lesion detection falls between valid measured tumor lesion summary days. This option is checked by default. If unchecked, all records with a valid date and whose tumor identification contains NEW are marked.
Mark subjects with selected disposition events in the waterfall plot
By default, the report marks only the occurrence of disposition events for a given subject on the spider/trend plot. If the Mark subjects with selected disposition events in the waterfall plot option is checked, then a black point marker is also used just above the best/last summary response value for a given subject in the waterfall plot provided the subject has any of the selected disposition events recorded.
Advanced
Options in this category affect wide-ranging aspects of system and report behavior that are not specific to a domain class. These include column, display, sort, adjunct data path, definition, and scale preferences, among others.
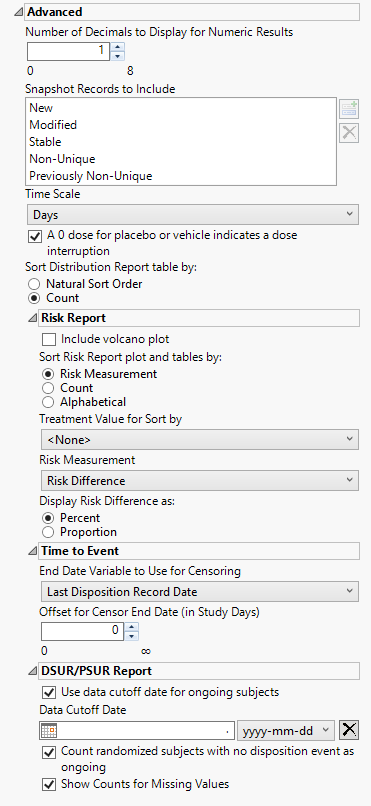
Number of Decimals to Display for Numeric Results
Use this option to specify the number of decimals to include in the plots and tables of numerical results.
Snapshot Records to Include
Use this widget to specify which updated snapshot records to include in your analysis.
Time Scale
Use this widget to specify the time scale to use for times. Options include Days, Weeks, Months, and Years. Refer to Time Scale for more information.
A 0 dose for placebo or vehicle indicates a dose interruption
Check this box if a dose of 0 for either the placebo or the vehicle indicates a dose interruption. When this box is unchecked, 0 doses is interpreted as a period where placebo or vehicle was given.
Sort Distribution Report table by:
Use the Sort Distribution Report table by: widget to specify how the rows in the distribution reports table are to be sorted.
Include volcano plot
Check the Include volcano plot box to include a volcano plot in the report.
Sort Risk Report plot and tables by:
Use the Sort Risk Report plot and tables by: widget to specify how the rows in the Risk Report plot and tables are to be sorted.
Treatment Value for Sort by:
Use this widget to specify the treatment value to sort the plots and tables by. This is especially useful when there are multiple treatment regimes. Refer to Treatment Value for Sort by for more information.
Risk Measurement
Use the Risk Measurement drop-down menu to specify the risk measurement to use.
Display Risk Difference as:
Use this widget to specify the difference between the risk of an event in the treatment arm and the control arm as either a percentage or a proportion of the total subject population. This widget appears only when you select Risk Difference as the Risk Measurement.
End Date Variable to Use for Censoring
Use the End Date Variable to Use for Censoring option for specifying the end date for censoring. Options include the reference end date, date of the last treatment, the date on which the subject left the study or the date of the last disposition record (selected by default).
Offset for Censor End Date (in Study Days)
Use this widget to specify the number of days to extend your analysis after the date specified using the End Date Variable for Censoring option.
Use data cutoff date for ongoing subjects
Check this box to use the date on which the study data was pulled for this report in place of exposure end date for ongoing subjects.
Data Cutoff Date
Use this option to specify the date on which the study data was pulled for this report. Refer to Data Cutoff Date for more information.
Count randomized subjects with no disposition event as ongoing
Check this box to count subjects who do not have a record in DS for either Completed or Discontinued as Ongoing for treatment and study status.
Show Counts for Missing Values
Check the box to add a row to summary statistics for the count of missing values.
Note: The previous version of JMP Clinical contained an advanced option to Preserve all input data set columns in reports. That option is now the default condition in JMP Clinical 18. All input data columns are preserved in the output data table.
Action Buttons
| 8 | Click to revert all study preferences to their default values. |
| 8 | Click to apply all changes to the study preferences. |
| 8 | Click to reject all changes and return study preferences to the previously saved state. |
Tips
Category disclosure states are saved, so Reset, OK, and Cancel apply to those states as well.
To view or edit multiple studies' preferences simultaneously, select at least two studies and click Set Study Preferences. This might be useful if a configuration-wide reset of study preferences is desired.
Where possible, study preferences propagate through study management operations (e.g., Refresh Study Metadata, Update Study with New Snapshot) or are otherwise updated to applicable defaults.