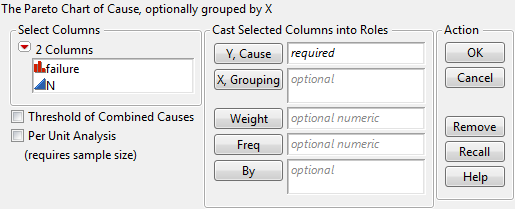
Launch the Pareto Plot platform by selecting Analyze > Quality and Process > Pareto Plot.
Figure 11.5 The Pareto Plot Launch Window
Identifies the grouping factor. The grouping variable produces one Pareto plot window with side-by-side plots for each value. You can have no grouping variable, one grouping variable (see One-Way Comparative Pareto Plot Example), or two grouping variables (see Two-Way Comparative Pareto Plot Example).
Enables you to specify a threshold for combining causes by specifying a minimum rate or count. Select the option and then select Tail % or Count and enter the threshold value. The Tail percent option combines smaller count groups against the percentage specified of the total (combined small groups count/total group count). The Count option enables you to specify a specific count threshold. For an example, see Threshold of Combined Causes Example.
Enables you to compare defect rates across groups. JMP calculates the defect rate as well as 95% confidence intervals of the defect rate. Select the option and then select Constant or Value in Freq Column and enter the sample size value or cause code, respectively. The Constant option enables you to specify a constant sample size on the launch window. The Value In Freq Column option enables you to specify a unique sample size for a group through a special cause code to designate the rows as cause rows.
