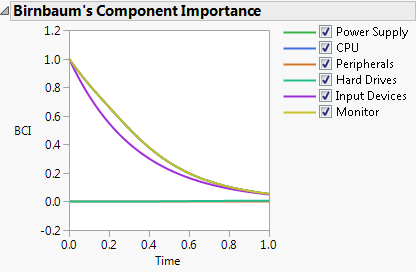
Select Show BCI to show an overlay plot of the Birnbaum’s Component Importance measures for each component of the selected system diagram. A component’s BCI at a given time is the probability that the system will fail if the component fails. A component with a large BCI is critical to system reliability.
Figure 10.21 Birnbaum’s Component Importance
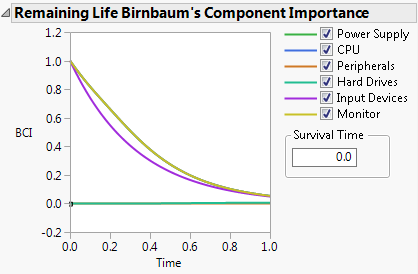
Select Show Remaining Life BCI to show an overlay plot of the Birnbaum’s Component Importance for Remaining Life. The BCI for Remaining Life is the probability that the system will fail if the component fails, given that the system has survived a specified amount of time, designated as Survival Time. By default, Survival Time is set to zero, and the BCI for Remaining Life is equivalent to the Birnbaum’s Component Importance.
Enter a value for Survival Time to indicate the time to which the system has survived without failing. As an alternative to entering a value, select the small rectangle at the origin of the graph and drag it to the right to dynamically set the Survival Time.
Figure 10.22 Birnbaum’s Component Importance for Remaining Life
Select Show Component Integrated Importance to show an overlay plot of the integrated importance measures for the components of the Reliability Block Diagram. The integrated importance measure for each component takes into account the failure rate of the component as well as the likelihood of failing instantaneously. See Si et al. (2012).
Figure 10.23 Component Integrated Importance
Select Show MTTF to view the Mean Time to Failure (MTTF) for the system.

 Birnbaum’s Component Importance
 Remaining Life BCI
 Component Integrated Importance
 Mean Time to Failure