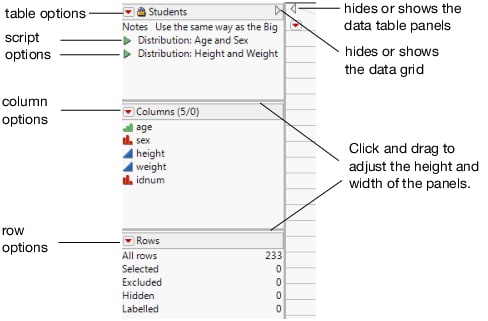
These panels are located on the left of the data grid. They contain information about the table and its contents. Each panel has interactive areas. See Figure 1.4.
Figure 1.4 Interacting with the Data Table Panels
Figure 1.5 Example of a Table Panel
Creates a new table variable, which can be text or any other constant character value that you always want to be available in the data table. Table variables are normally used to document tables. See Use Table Variables in Enter and Edit Data for more information.
Creates a JSL script to save with the data table. After selecting this command, name the script and type in the value (the JSL commands). After you click OK, the new script is listed in the Table panel and you can click its green triangle to run, edit, or delete it. See Create and Save Scripts in Enter and Edit Data.
Locks the data table so that data and column properties cannot be edited or added. You can still run analyses and assign characteristics. See Lock Tables in Enter and Edit Data.
Compresses the data table when it is saved. After the data table is saved, a compressed file icon  appears next to the data table name in the table panel. See Compress Tables in Enter and Edit Data.
The Compress file when saved option only decreases the file size. This command does not affect the memory required to analyze the data. To reduce both the file size and memory required for analyzing, use Cols > Utilities > Compress Selected Columns. See Compress Selected Columns in Enter and Edit Data.
Tip: You can also configure JMP to always use GZ compression when saving tables by selecting Preferences > General > Save Data Table Columns GZ Compressed.
|
•
|
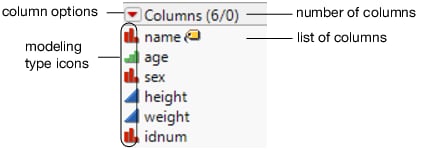
Figure 1.6 Example of a Columns Panel
 Indicates that points on plots corresponding to the column are labeled by the value instead of the row number. See Label Rows and Columns in Enter and Edit Data.
 Indicates that the column is excluded from the calculations. See Exclude Rows in Enter and Edit Data.
 Can be X or Y. Indicates that the column has been assigned the preselected role of x or y. See Assign a Preselected Analysis Role in The Column Info Window.
 Indicates that the values in the column result from a formula. When formula evaluation is suppressed, the icon appears gray. Double-click to view and edit the formula. See Use Formula Editor Options in Formula Editor.
 Indicates that the range check or the list check option is turned on. Click to view and edit the range or list. See Range Check in The Column Info Window and List Check in The Column Info Window.
 Indicates that the column has been assigned the preselected role of weight. See Assign a Preselected Analysis Role in The Column Info Window.
 Indicates that the column has been assigned the preselected role of frequency. See Assign a Preselected Analysis Role in The Column Info Window.
|
•
|
Row options (same options as the Rows menu)
|
Figure 1.8 Example of a Rows Panel
Right-click the categories in the Rows panel to select rows, clear the selection, or to create a data view.
A data view creates a linked subset of the main data table. For example, if several rows are marked hidden, you might want to open a window that shows you only the hidden rows. Right-click Hidden in the Rows panel and select Data View.
Figure 1.9 Creating a Data View from the Rows Panel


 Indicates that the column contains one or more properties. Click to reveal a list of properties the column contains.
 Indicates that the column has a Link Reference column property. This property links a column in the current data table to the ID column in the referenced data table. Blue indicates that the referenced data table is linked.
 Indicates that the column has a Link Reference column property. Gray indicates that the referenced data table is not open or not linked properly.
 Indicates that the column has a Link ID column property, which marks a column in the data table as the ID column. That is, the rows of the data table are uniquely identified by the values of the ID column.
 Indicates that the column is linked from the referenced data table.
