For the latest version of JMP Help, visit JMP.com/help.


Basic Analysis > Distributions
Publication date: 05/05/2023

Distributions

Using the Distribution Platform

Use the Distribution platform to explore the distribution of a single variable using histograms, box plots, and summary statistics. You can perform several types of hypothesis tests, including t tests, z tests, chi-squared tests, and equivalence tests. You can also construct confidence, tolerance, and prediction intervals, and estimate process capability. The word univariate simply means involving one variable instead of two (bivariate) or many (multivariate). However, you can examine the distribution of several individual variables within a report. The report content for each variable depends on whether the variable is categorical (nominal or ordinal) or continuous.

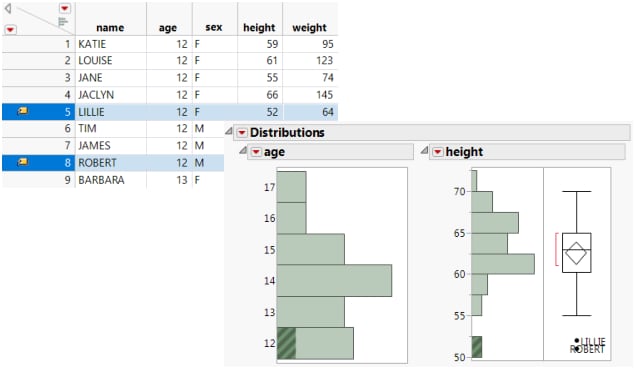
The Distribution report window is interactive. Clicking on a histogram bar highlights the corresponding data in any other histograms and in the data table.

Figure 3.1 Example of the Distribution Platform 
Example of the Distribution Platform

Contents

Overview of the Distribution Platform

Example of the Distribution Platform

Launch the Distribution Platform

The Distribution Report

Histograms
The Frequencies Report
The Quantiles Report
The Summary Statistics Report

Distribution Platform Options

Options for Categorical Variables

Histogram Options for Categorical Variables
Save Options for Categorical Variables

Options for Continuous Variables

Display Options for Continuous Variables
Histogram Options for Continuous Variables
Normal Quantile Plot
Outlier Box Plot
Quantile Box Plot
Stem and Leaf
CDF Plot
Test Mean
Test Std Dev
Test Equivalence
Confidence Intervals
Prediction Intervals
Tolerance Intervals
Process Capability
Fit Distributions
Save Options for Continuous Variables

Additional Examples of the Distribution Platform

Example of Selecting Data in Multiple Histograms
Example of a By Variable
Example of Testing Probabilities for Two Levels
Example of Testing Probabilities for More Than Two Levels
Example of Prediction Intervals
Example of Tolerance Intervals
Example of Process Capability
Example of Detection Limits

Statistical Details for the Distribution Platform

Statistical Details for Standard Error Bars
Statistical Details for Quantiles
Statistical Details for Summary Statistics
Statistical Details for the Normal Quantile Plot
Statistical Details for the Wilcoxon Signed Rank Test
Statistical Details for the Standard Deviation Test
Statistical Details for Normal Quantiles
Statistical Details for Saving Standardized Data
Statistical Details for Score Confidence Intervals
Statistical Details for Prediction Intervals
Statistical Details for Tolerance Intervals
Statistical Details for Continuous Fit Distributions
Statistical Details for Discrete Fit Distributions
Want more information? Have questions? Get answers in the JMP User Community (community.jmp.com).