Independent Variables
The Independent Variables section in the Surface Plot report contains the following controls:
X, Y
Radio buttons that enable you to select which independent variables are displayed on the x- and y-axes. This feature is useful when you have more than two independent variables.
Value
The sliders and text boxes set the current values of each variable. These settings are most important for the variables that are not displayed on the axes. The plot shows the three-dimensional slice of the surface at the value shown in the text box. Move the slider to see different slices.
Lock Z Scale
Locks the Z axis to its current values. This is useful when moving the sliders that are not on an axis.
Grid
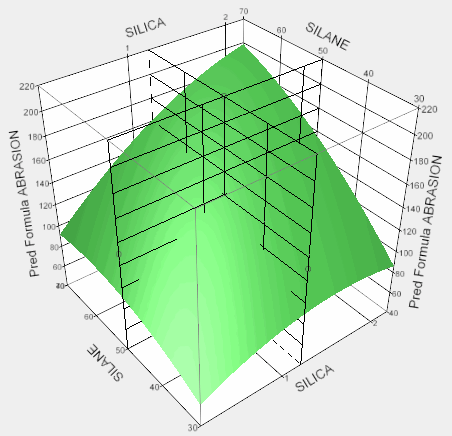
Selecting a check box activates a grid that is perpendicular to the selected variables axis. The sliders enable you to adjust the placement of each grid. The resolution of each grid can be controlled by adjusting axis settings. Figure 5.9 shows a surface with the X and Y grids activated.
Figure 5.9 Activated X and Y Grids
