Score Summaries
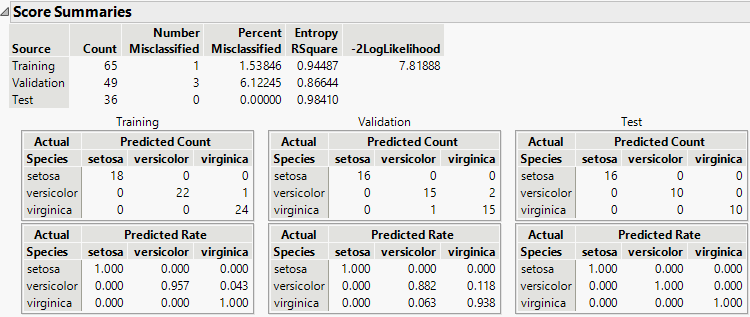
In the Discriminant Analysis report, the Score Summaries section provides an overview of the discriminant scores. The table in Figure 5.10 shows Actual and Predicted classifications. If all observations are correctly classified, the off-diagonal counts are zero.
Figure 5.10 Score Summaries for Iris.jmp
The Score Summaries report provides the following information:
Columns
If you used Stepwise Variable Selection to construct the model, the columns entered into the model are listed.
Source
If no validation is used, all observations comprise the Training set. If validation is used, a row is shown for the Training and Validation sets, or for the Training, Validation, and Test sets.
Number Misclassified
Provides the number of observations in the specified set that are incorrectly classified.
Percent Misclassified
Provides the percent of observations in the specified set that are incorrectly classified.
Entropy RSquare
A measure of fit. Larger values indicate better fit. An Entropy RSquare value of 1 indicates that the classifications are perfectly predicted. Because uncertainty in the predicted probabilities is typical for discriminant models, Entropy RSquare values tend to be small.
See Entropy RSquare.
Note: It is possible for Entropy RSquare to be negative.
-2LogLikelihood
Twice the negative log-likelihood of the observations in the training set, based on the model. Smaller values indicate better fit. Provided for the training set only. See Likelihood, AICc, and BIC in Fitting Linear Models.
Confusion Matrices
Shows matrices of actual by predicted counts for each level of the categorical X. If you are using JMP Pro with validation, a matrix is given for each set of observations. If you are using JMP with excluded rows, the excluded rows are considered the validation set and a separate Validation matrix is given. See Validation in JMP and JMP Pro.
Entropy RSquare
The Entropy RSquare is a measure of fit. It is computed for the training set and for the validation and test sets if validation is used.
Entropy RSquare for the Training Set
For the training set, Entropy RSquare is computed as follows:
• A discriminant model is fit using the training set.
• Predicted probabilities based on the model are obtained.
• Using these predicted probabilities, the likelihood is computed for observations in the training set. Call this Likelihood_FullTraining.
• The reduced model (no predictors) is fit using the training set.
• The predicted probabilities for the levels of X from the reduced model are used to compute the likelihood for observations in the training set. Call this quantity Likelihood_ReducedTraining.
• The Entropy RSquare for the training set is:

Entropy RSquare for Validation and Test Sets
For the validation set, Entropy RSquare is computed as follows:
• A discriminant model is fit using only the training set.
• Predicted probabilities based on the training set model are obtained for all observations.
• Using these predicted probabilities, the likelihood is computed for observations in the validation set. Call this Likelihood_FullValidation.
• The reduced model (no predictors) is fit using only the training set.
• The predicted probabilities for the levels of X from the reduced model are used to compute the likelihood for observations in the validation set. Call this quantity Likelihood_ReducedValidation.
• The Validation Entropy RSquare is:

The Entropy RSquare for the test set is computed in a manner analogous to the Entropy RSquare for the Validation set.
