Observed Data Report
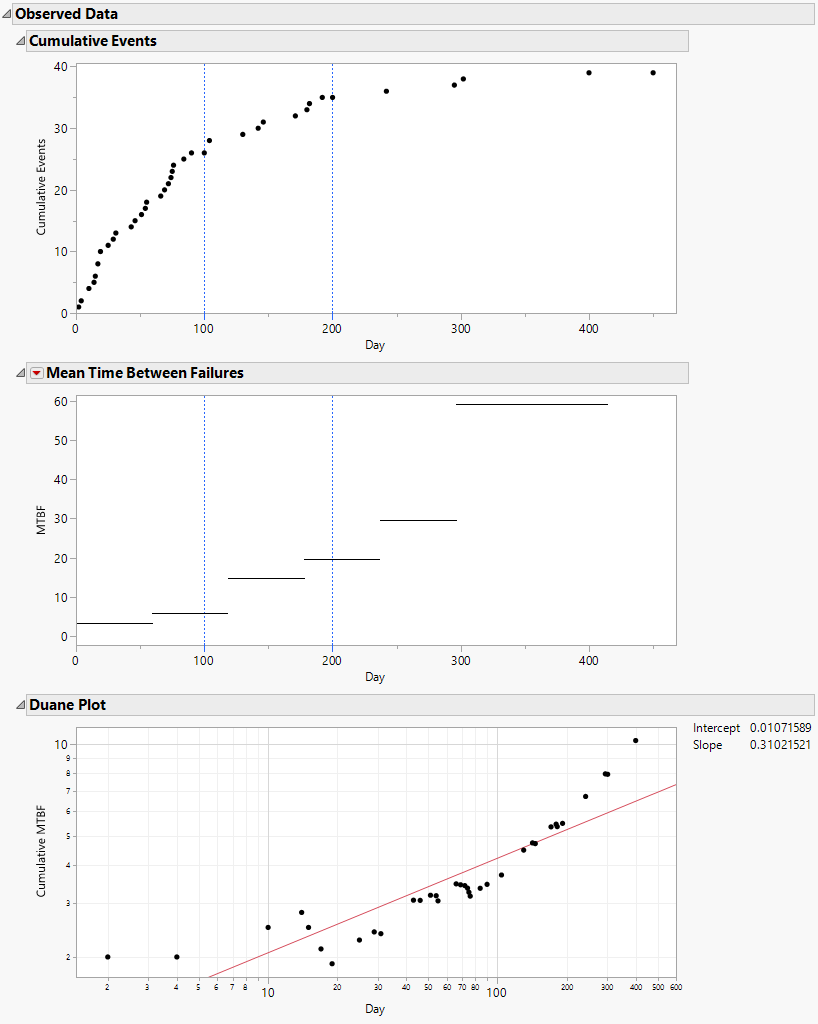
In the Reliability Growth platform, the Observed Data report contains the Cumulative Events plot, the Mean Time Between Failures plot, and the Duane plot. These are shown in Figure 11.7, where the Mean Time Between Failures and Duane Plot reports have been opened. To produce this report, follow the instructions in Example of the Reliability Growth Platform.
Figure 11.7 Observed Data Report
Cumulative Events Plot
The Cumulative Events plot shows how events are accumulating over time. The vertical coordinate for each point on the Cumulative Events plot equals the total number of events that have occurred by the time given by the point’s horizontal coordinate.
Whenever a model is fit, that model is represented on the Cumulative Events plot. Specifically, the cumulative events estimated by the model are shown by a curve, and 95% confidence intervals are shown by a solid band. Check boxes to the right of the plot enable you to control which models are displayed.
For the Parallel Systems data format, the Cumulative Events plot has a separate panel in the plot for each level of the System ID variable. It also contains a panel at the bottom of the plot that overlays the cumulative events for all levels of the System ID variable. The levels of the System ID variable are designated by colors.
Mean Time Between Failures Plot
The Mean Time Between Failures plot shows mean times between failures averaged over small time intervals of equal length. These are not tied to the Phases. The default number of equal length intervals is based on the number of rows.
Mean Time Between Failures Plot Options
Click the Mean Time Between Failures red triangle and select Options to open a window that enables you to specify intervals over which to average.
Two types of averaging are offered:
• Equal Interval Average MTBF (Mean Time Between Failures) enables you to specify a common interval size.
• Customized Average MTBF enables you to specify cut-off points for time intervals.
– Double-click within a table cell to change its value.
– Right-click in the table to open a menu that enables you to add and remove rows.
Duane Plot
The Duane Plot displays Cumulative MTBF estimates plotted against the Time to Event variable, with both axes on a log10 scale. If the data follow the Crow-AMSAA model, the points should follow a line when plotted on log-log paper.
Note: The Duane Plot is available only if failure times are exact and Time to Event Format is used. The plot is not available for interval-censored data or data entered in Dates Format.
The line displayed on the plot is the least squares regression line for the regression of log10 of Cumulative MTBF on log10 of the Time to Event variable.
Note: The Duane Plot does not reflect Phase variables. Rows where the Time to Event variable defines Phase changes are ignored in constructing the plot and fitting the regression line.
Intercept and Slope
Intercept and Slope values are displayed to the right of the plot.
• The Intercept value is given, for historical reasons, as the intercept for a fit in the natural logarithmic scale. Specifically, the natural logarithm of Cumulative MTBF is regressed on the natural logarithm of Time to Event. The value of Intercept is the value predicted by this regression equation at log(1) = 0, where log is the natural logarithm. To obtain the intercept for a fit in terms of base 10 logarithms, divide the Intercept value by log(10). See Tobias and Trindade (2012, ch. 13).
• The Slope value is the slope for a fit in either the natural or the logarithmic scale. This follows from the properties of logarithms.
