Power Analysis
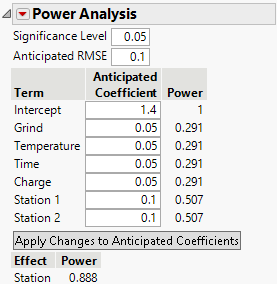
The Power Analysis section enables you to specify assumptions for power calculations, as well as values for the Significance Level and Anticipated RMSE. These specifications are used to calculate the power of the tests for the model parameters. Power is the probability of detecting an active effect of a given size. The Power Analysis section helps you evaluate the ability of your design to detect effects of practical importance. The higher your power, the more likely you are to detect significant effects assuming your coefficient and RMSE assumptions are correct. Power depends on the number of runs, the significance level, and the estimated error variation.
Significance Level
The probability of rejecting the hypothesis of no effect, if it is true.
Anticipated RMSE
An estimate of the square root of the error variation.
The power analysis table contains the following columns.
Term
The model term associated with the coefficient being tested.
Anticipated Coefficient
An assumed value for the coefficient associated with the model term. This assumed value reflects the difference that you want to detect in the response due to a change in that term from its low to high level or between categories. The coefficients are used in the calculations of Power. These values are also used to calculate the Anticipated Responses in the Design and Anticipated Responses section. When you set a new value in the Anticipated Coefficient column, click Apply Changes to Anticipated Coefficients to update the Power and Anticipated Response columns.
Notes:
– The anticipated coefficients have default values of 1 for continuous effects. This corresponds to a two unit change in the response for a change from the low to high level of a continuous effect.
– The anticipated coefficients have default values of 1 and –1 for categorical effects.
– You can specify a value for Delta be selecting Advanced Options > Set Delta for Power from the Power Analysis red triangle menu. If you change the value of Delta, the values of the anticipated coefficients are updated so that their absolute values are one-half of Delta. See Set Delta for Power.
Power
the probability of rejecting the null hypothesis of no effect when the true coefficient value is given by the specified Anticipated Coefficient. For a coefficient associated with a numeric factor, the change in the mean response (based on the model) is twice the coefficient value. For a coefficient associated with a categorical factor, the change in the mean response (based on the model) across the levels of the factor equals twice the absolute value of the anticipated coefficient. Calculations use the specified Significance Level and Anticipated RMSE. For more information about the power calculation, see “Power for a Single Parameter”.
Apply Changes to Anticipated Coefficients
Applies the anticipated coefficient values to the Power calculations and the Anticipated Responses.
If your model contains a categorical factor with more than two levels, then the following columns appear below the Apply Changes to Anticipated Coefficients button:
Effect
The categorical factor.
Power
The power calculation for a test of no effect. The null hypothesis for the test is that all model parameters corresponding to the effect are zero. The difference to be detected is defined by the values in the Anticipated Coefficient column that correspond to the model terms for the effect. The power calculation reflects the differences in response means determined by the anticipated coefficients. Calculations use the specified Significance Level and Anticipated RMSE. For more information about the power calculation, see “Power for a Categorical Effect”.
Figure 16.7 Power Analysis Report with Categorical Factors
Design and Anticipated Responses
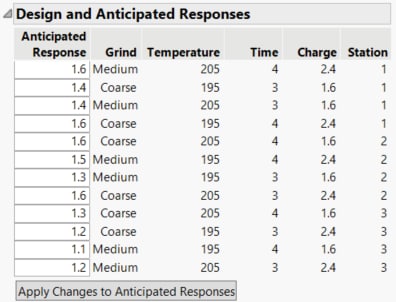
The Design and Anticipated Responses section shows the design preceded by an Anticipated Response column. The Anticipated Response for each design settings is calculated using the Anticipated Coefficients.
Anticipated Response
An assumed response value for each run in the design. When the section first appears, the calculation of Anticipated Response values is based on the default values in the Anticipated Coefficient column. The assumed values can be updated directly in this table or by updating the Anticipated Coefficients.
Design
The columns to the right of the Anticipated Response column show the factor settings for all runs in the design.
Apply Changes to Anticipated Responses
Applies values from the Anticipated Response column to the Anticipated Coefficients. This also updates the power calculations and the Anticipated RMSE.
Figure 16.8 Anticipated Responses
The power analysis red triangle menu contains the following options:
Solve for Power
Enables you to specify a desired power. The Anticipated Coefficients are updated to the size that are detectable with the specified power.
Set Delta for Power
Enables you to specify a value for the difference that you want to detect that is applied to Anticipated Coefficients. The Anticipated Coefficient values are set to Delta/2 for continuous effects. For categorical effects, they are set to alternating values of Delta/2 and –Delta/2. For more information about power analysis, see Power Analysis.
By default, the Delta value is set to two. Consequently, the Anticipated Coefficient default values are 1 for continuous effects and alternating values of 1 and –1 for categorical effects. The default values that are entered as Anticipated Coefficients when Delta is 2 ensure that the following properties hold:
– The power calculation for a numeric effect assumes a change of Delta in the response mean due to linear main effects as the factor changes from the lowest setting to the highest setting in the design region.
– The power calculation for the parameter associated with a two-level categorical factor assumes a change of Delta in the response mean across the levels of the factor.
– The power calculation for a categorical effect with more than two levels is based on the multiple degree of freedom F test for the null hypothesis that all levels have the same response mean. Power is calculated at the values of the response means that are determined by the Anticipated Coefficients. Various configurations of the Anticipated Coefficients can define a difference in levels as large as Delta. However, the power values for such configurations differ based on the Anticipated Coefficients for the other levels.

