Publication date: 06/27/2024
Attribute Gauge Charts
Evaluate a Categorical Measurement Process Using Agreement Measures
Attribute charts analyze categorical measurements and can help show you measures of agreement across responses, such as raters. In attribute data, the variable of interest has a finite number of categories. Typically, data has only two possible results, such as pass or fail. You can examine aspects such as how effective raters were at classifying a part, how much they agreed with each other, and how much they agreed with themselves over the course of several ratings.
Tip: This chapter covers only attribute charts. For more information about variability charts, see Variability Gauge Charts.
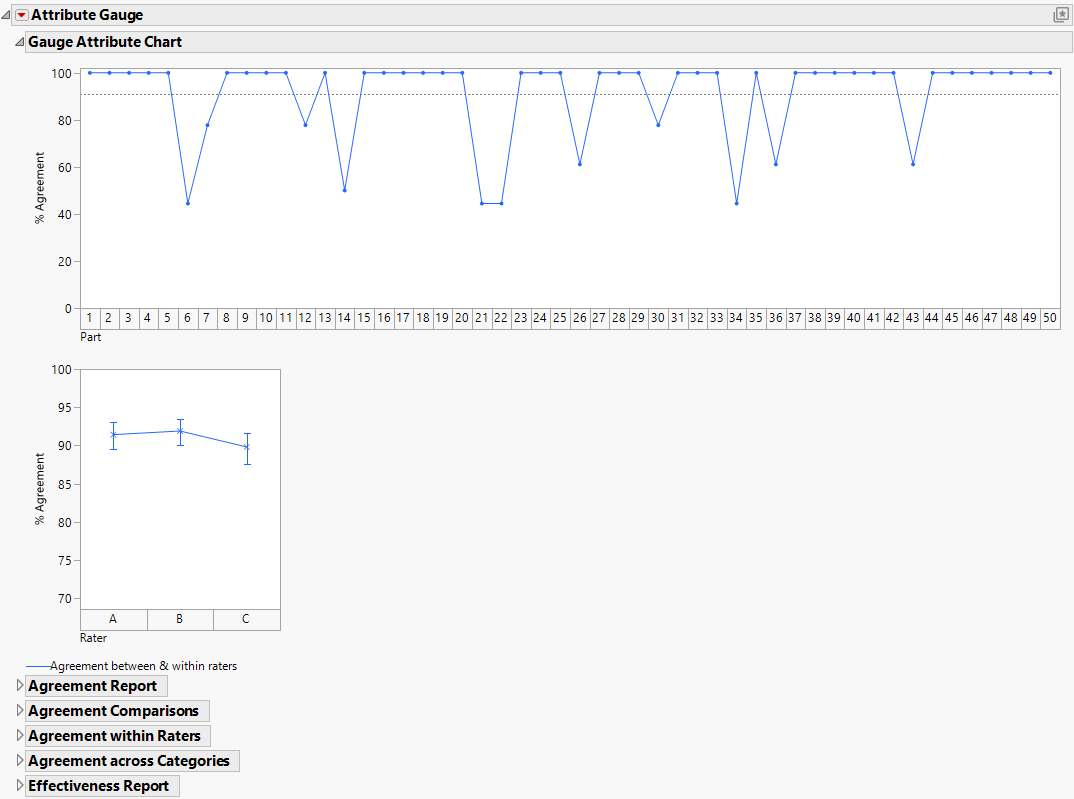
Figure 7.1 Example of an Attribute Chart
Contents
Overview of Attribute Gauge Charts
Example of an Attribute Gauge Chart
Launch the Attribute Gauge Chart Platform
The Attribute Gauge Report
Gauge Attribute Chart
Agreement Reports
Effectiveness Report
Attribute Gauge Platform Options
Statistical Details for Attribute Gauge Charts
Statistical Details for the Gauge Attribute Chart
Statistical Details for the Agreement Report
Want more information? Have questions? Get answers in the JMP User Community (community.jmp.com).
