Effectiveness Report
In the Attribute Gauge report, the Effectiveness Report compares every rater with the standard. This report appears only if you have specified a Standard variable in the launch window. For a description of a Standard variable, see Launch the Attribute Gauge Chart Platform.
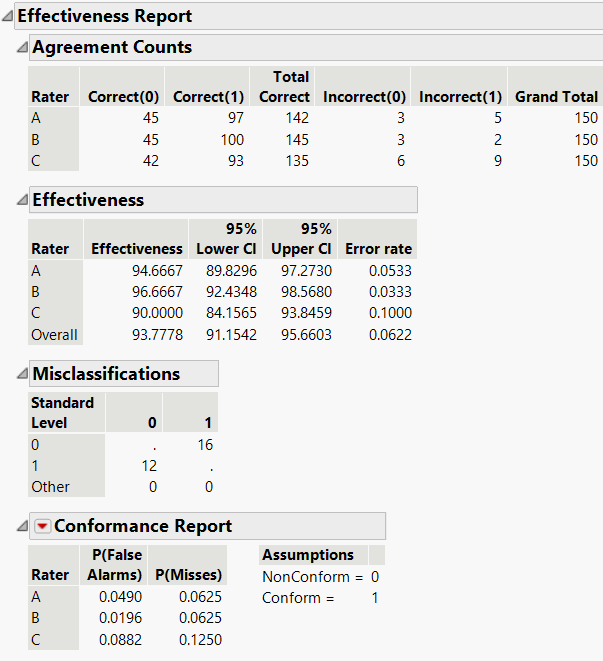
Figure 7.8 Effectiveness Report
The Agreement Counts table shows cell counts on the number correct and incorrect for every level of the standard. In Figure 7.8, the standard variable has two levels, 0 and 1. Rater A had 45 correct responses and 3 incorrect responses for level 0, and 97 correct responses and 5 incorrect responses for level 1.
Effectiveness is defined as the number of correct decisions divided by the total number of opportunities for a decision (Automotive Industry Action Group, 2010). For example, say that rater A sampled every part three times. On the sixth part, one of the decisions did not agree (for example, pass, pass, fail). The other two decisions would still be counted as correct decisions.
In the Effectiveness table, 95% confidence intervals are given about the effectiveness. These are score confidence intervals. It has been demonstrated that score confidence intervals provide increased coverage probability, particularly where observations lie near the boundaries. See Agresti and Coull (1998).
The Misclassifications table shows the incorrect labeling. The rows represent the levels of the standard or accepted reference value. The columns contain the levels given by the raters.
Conformance Report
The Conformance Report shows the probability of false alarms and the probability of misses. This report appears only when the rating has two levels (such as pass or fail, or 0 or 1).
The following descriptions apply:
False Alarm
The part is determined to be non-conforming, when it actually is conforming.
Miss
The part is determined to be conforming, when it actually is not conforming.
P(False Alarms)
The number of parts that have been incorrectly judged to be nonconforming divided by the total number of parts that are judged to be conforming.
P(Miss)
The number of parts that have been incorrectly judged to be conforming divided by the total number of parts that are actually nonconforming.
The Conformance Report red triangle menu contains the following options:
Change Conforming Category
Reverses the response category that is considered conforming.
Calculate Escape Rate
Calculates the Escape Rate, which is the probability that a non-conforming part is produced and not detected. The Escape Rate is calculated as the probability that the process produces a non-conforming part multiplied by the probability of a miss. You specify the probability that the process produces a non-conforming part, also called the Probability of Nonconformance.
Note: Missing values are treated as a separate category in this platform. To avoid this separate category, exclude rows of missing values in the data table.
