Edit a Dashboard
Example of Creating a Dashboard with Two JMP Reports shows how to create a dashboard from two reports. This section shows how to arrange those reports and preview the final dashboard.
Rearrange Reports in Dashboard Edit Mode
To help you rearrange reports while editing a dashboard, the outline around a report includes drop zones. When you drag the report into a different area of the box, a portion of the box is highlighted. The highlight shows where you can drop the box.
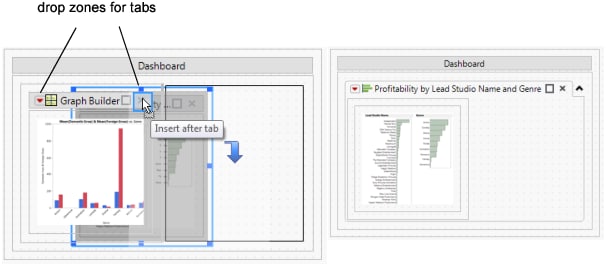
Figure 12.4 shows how to create tabbed reports. To put the Distribution report inside a tab, drag the report over the other report until the upper right corner of the bar chart report is highlighted. The Distribution report appears in a tab on top of the other report.
To remove a tabbed report, click the middle of the report and drag it outside of the tab.
Figure 12.4 Working with Tabbed Reports in Dashboard Edit Mode
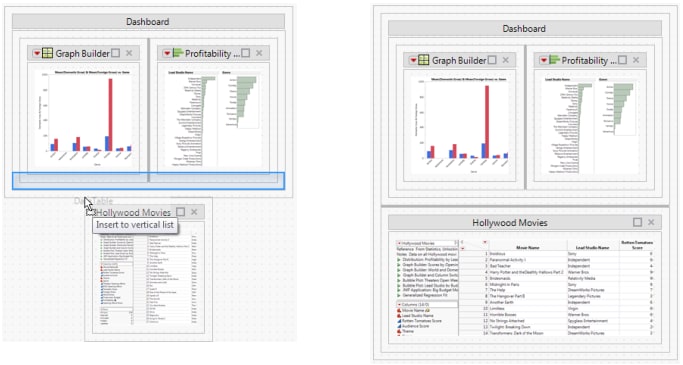
Figure 12.5 shows an example of placing a data table inside the bottom border of the report.
To display the data table below the report instead of inside it, drag the Data Table box onto the dashboard below the report. The box snaps inside the bottom border of the report.
Figure 12.5 Displaying a Data Table Inside a Report
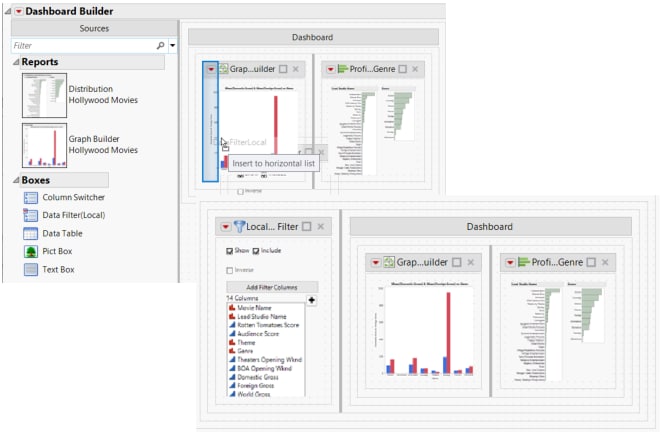
Figure 12.6 shows a data filter that appears to the left of a report.
Figure 12.6 Adding a Data Filter to the Left of a Report
Tip: It can be hard to tell which report a filter is acting upon, or if a filter applies to all graphs. You can change the title of a data filter to indicate which graphs it impacts.
Format Text in a Dashboard
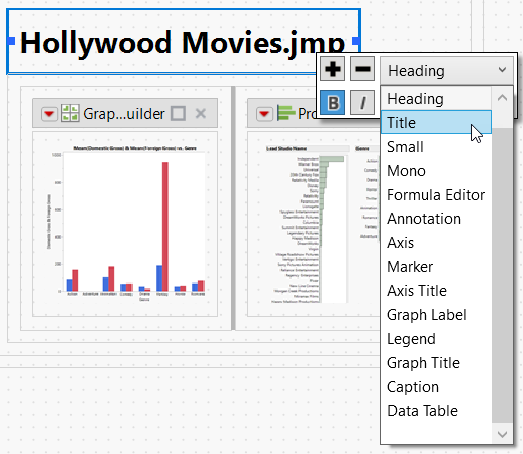
When you edit a dashboard, you can format text in a text box. Drag the text box to the dashboard and click the middle of the text box. Formatting options appear.
Figure 12.7 Formatting Options for a Text Box
Preview a Dashboard
When you edit a dashboard, you can see a preview of the final dashboard by selecting Preview Mode from the Dashboard Builder red triangle menu. Previewing a dashboard is particularly helpful when testing interactive elements such as column switchers, data filters, and tabbed reports.
Note: If you resize panes in preview mode, your changes are not saved.
Tips:
• The column switcher initially shows all columns in the table, but it does not actively make changes to reports in the dashboard or application.
• You should switch into preview mode to do the following:
– Select the initial column to be switched in all reports.
– Remove any columns that you do not want to appear in the column switcher, including any other columns that are used in the reports.
• When you run the dashboard or application, the column switcher automatically connects to all platforms in the dashboard that use the same data table.


