Examples of Viewing Summary Statistics
Summary statistics, such as sums and means, can instantly provide useful information about your data. For example, if you look at the annual profit of each company out of thirty-two companies, it is difficult to compare the profits of small, medium, and large companies. A summary shows that information immediately.
Create summary tables by using either the Summary or Tabulate commands. The Summary command creates a new data table. As with any data table, you can perform analyses and create graphs from the summary table. The Tabulate command creates a report window with a table of summary data. You can also create a table from the Tabulate report.
Summary Table Example
A summary table contains statistics for each level of a grouping variable. For example, look at the financial data for computer and pharmaceutical companies. Suppose that you want to calculate the mean of sales and the mean of profits, for each combination of company type and size.
1. Select Help > Sample Data Folder and open Companies.jmp.
2. Select Tables > Summary.
3. Select Type and Size Co and click Group.
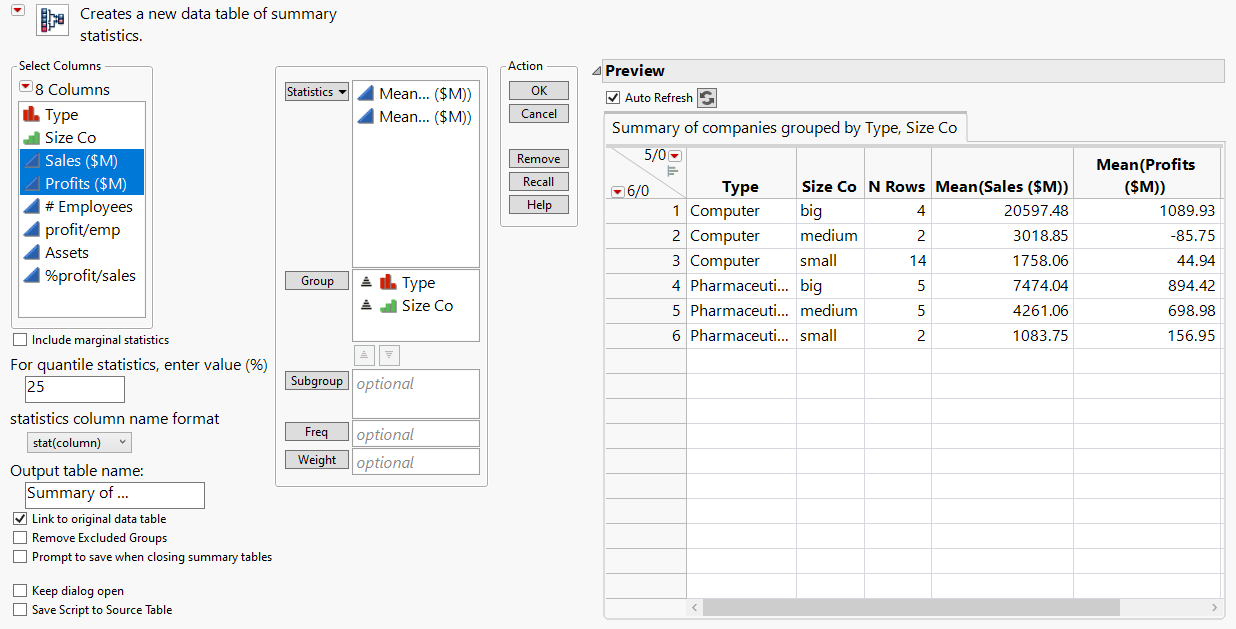
4. Select Sales ($M) and Profits ($M) and click Statistics > Mean.
Figure 3.18 Completed Summary Window
5. Click OK.
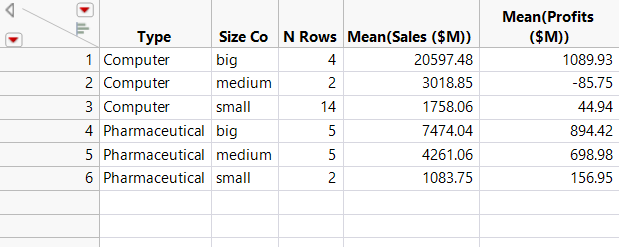
JMP calculates the mean of Sales ($M) and the mean of Profit ($M) for each combination of Type and Size Co.
Figure 3.19 Summary Table
The summary table contains the following:
• There are columns for each grouping variable (in this example, Type, and Size Co).
• The N Rows column shows the number of rows from the original table that correspond to each combination of grouping variables. For example, the original data table contains 14 rows corresponding to small computer companies.
• There is a column for each summary statistic requested. In this example, there is a column for the mean of Sales ($M) and a column for the mean of Profits ($M).
The summary table is linked to the source table. Selecting a row in the summary table also selects the corresponding rows in the source table.
Tabulate Example
Use the Tabulate command to drag columns into a workspace, creating summary statistics for each combination of grouping variables. This example shows you how to use Tabulate to create the same summary information that you just created using Summary.
1. Select Help > Sample Data Folder and open Companies.jmp.
2. Select Analyze > Tabulate.
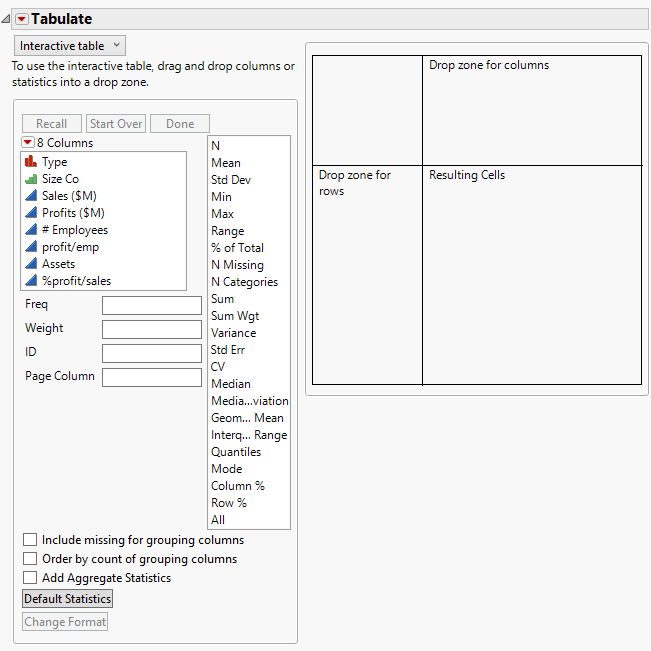
Figure 3.20 Tabulate Workspace
3. Select both Type and Size Co.
4. Drag and drop them into the Drop zone for rows.
Figure 3.21 Dragging Columns to the Row Zone
5. Right-click a heading and select Nest Grouping Columns.
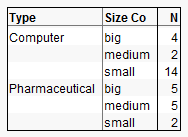
The initial tabulation shows the number of rows per group.
Figure 3.22 Initial Tabulation
6. Select both Sales ($M) and Profits ($M), and drag and drop them over the N in the table.
Figure 3.23 Adding Sales and Profit
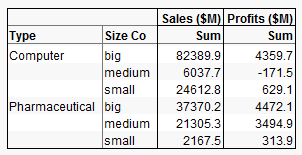
The tabulation now shows the sum of Sales ($M) and the sum of Profits ($M) per group.
Figure 3.24 Tabulation of Sums
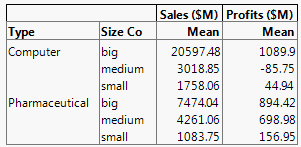
7. The final step is to change the sums to means. Right-click Sum (either of them) and select Statistics > Mean.
Figure 3.25 Final Tabulation
The means are the same as those obtained using the Summary command. Compare Figure 3.25 to Figure 3.19.
