Fit Line, Fit Polynomial, and Fit Special Reports
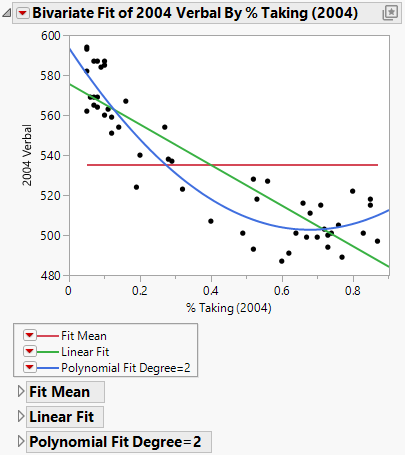
In the Bivariate platform, use the Fit Line, Fit Polynomial, or Fit Special options to fit regression models. You can fit multiple models and then compare the fits on the scatterplot.
Figure 5.8 Example of Fit Line and Fit Polynomial
For more information about the options in the Linear Fit and Polynomial Fit Degree menus, see Bivariate Fit Options. For statistical details, see Statistical Details for the Fit Line Option.
In the Bivariate platform, there is a report for each fit that you select. The Linear, Polynomial, and Transformed Fit reports each contain a text box with the equation of the fit. Each fit report contains tables for a summary of fit, an analysis of variance (ANOVA), and parameter estimates. A fourth table, for Lack of Fit, appears if there are replicates in your data. Fits for a transformed Y variable include a summary of fit measures on the original scale table.
Summary of Fit
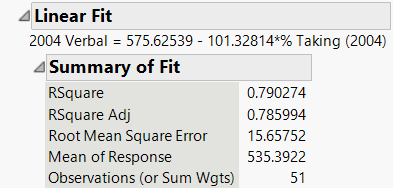
In the Bivariate platform fit reports, the Summary of Fit table contains numerical summaries of the model fit. The equation for the fit is shown above the Summary of Fit table.
Figure 5.9 Summary of Fit Table
The Summary of Fit table contains the following statistics:
RSquare
The proportion of the variation explained by the model. The remaining variation is attributed to random error. The RSquare is 1 if the model fits perfectly. See Statistical Details for the Summary of Fit Report.
Note: A low RSquare value suggests that there might be variables not in the model that account for the unexplained variation. However, if your data are subject to a large amount of inherent variation, even a useful regression model can have a low RSquare value. Read the literature in your research area to learn about typical RSquare values.
RSquare Adj
The RSquare statistic adjusted for the number of parameters in the model. The adjusted R2 statistic enables you to make comparisons among models that contain different numbers of parameters. See Statistical Details for the Summary of Fit Report.
Root Mean Square Error
The estimate of the standard deviation of the random error. This quantity is the square root of the mean square for Error in the Analysis of Variance report (Figure 5.11).
Mean of Response
The sample mean (arithmetic average) of the response variable. This is the predicted response when no model effects are specified.
Observations (or Sum Wgts)
The number of observations used to estimate the fit. If there is a weight variable, this is the sum of the weights.
Lack of Fit
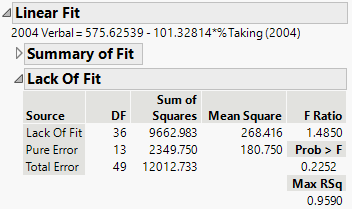
In the Bivariate fit reports, the Lack of Fit table contains the results of a lack of fit test. The lack of fit test is available only when there are replicated X values and the model is not saturated. A sum of squares calculated from the replicates is called pure error. This is the portion of the overall error that cannot be explained or predicted no matter what form of model is used.
Figure 5.10 Lack of Fit Table for a Linear Fit
The difference between the residual error from the model and the pure error is called the lack of fit error. The lack of fit error can be significantly greater than the pure error if you have a misspecified model. A misspecified model is one that does a poor job of describing the data. The null hypothesis in the lack of fit test is that the lack of fit error is zero. Therefore, a small p-value indicates a significant lack of fit.
The Lack of Fit table contains the following columns:
Source
The three sources of variation: Lack of Fit, Pure Error, and Total Error.
DF
The degrees of freedom (DF) for each source of error.
– The Total Error DF is the degrees of freedom found on the Error line of the corresponding Analysis of Variance (ANOVA) table. See Analysis of Variance. The Total Error DF value is the difference between the Total DF and the Model DF values found in the ANOVA table. The Error DF is partitioned into degrees of freedom for lack of fit and for pure error.
– The Pure Error DF is pooled from each replicated group of observations. See Statistical Details for the Lack of Fit Report.
– The Lack of Fit DF is the difference between the Total Error and Pure Error DF.
Sum of Squares
The sum of squares (SS) for each source of error.
– The Total Error SS is the sum of squares found on the Error line of the corresponding Analysis of Variance table. See Analysis of Variance.
– The Pure Error SS is pooled from each replicated group of observations. The Pure Error SS divided by its DF estimates the variance of the response at a given predictor setting. This estimate is unaffected by the model. See Statistical Details for the Lack of Fit Report.
– The Lack of Fit SS is the difference between the Total Error and Pure Error sum of squares. If the lack of fit SS is large, the model might not be appropriate for the data.
Mean Square
The mean square for the Source, which is the Sum of Squares divided by the DF. A Lack of Fit mean square that is large compared to the Pure Error mean square suggests that the model is not fitting well. The F ratio can be used to conduct a formal hypothesis test.
F Ratio
The ratio of the Lack of Fit mean square to the Pure Error mean square. The larger the F Ratio value, the less likely that the lack of fit error is zero.
Prob > F
The p-value for the lack of fit test. The null hypothesis is that the lack of fit error is zero. A small p-value indicates a significant lack of fit.
Max RSq
The maximum R2 value that can be achieved by a model using only the variables in the model. See Statistical Details for the Lack of Fit Report.
Analysis of Variance
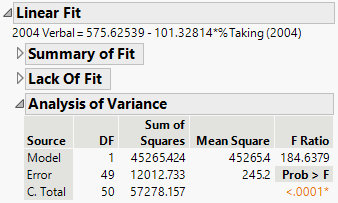
In the Bivariate fit reports, the Analysis of Variance table contains the calculations for comparing the fitted model to a model where all predicted values equal the response mean. The values in the analysis of variance (ANOVA) table are used to compute an F-ratio to evaluate the effectiveness of the model. If the p-value associated with the F-ratio is small, then the model is considered a better fit for the data than the response mean alone.
Figure 5.11 Analysis of Variance Table for a Linear Fit
The Analysis of Variance table contains the following columns:
Source
The three sources of variation: Model, Error, and C. Total (Corrected Total).
DF
The associated degrees of freedom (DF) for each source of variation. The C. Total DF is always one less than the number of observations, and it is partitioned into degrees of freedom for the Model and Error as follows:
– The Model DF is the number of parameters (other than the intercept) used to fit the model.
– The Error DF is the difference between the C. Total DF and the Model DF.
Sum of Squares
The associated Sum of Squares (SS) for each source of variation:
– The total (C. Total) SS is the sum of the squared differences between the response values and the sample mean. It represents the total variation in the response values.
– The Error SS is the sum of the squared differences between the fitted values and the actual values. It represents the variability that remains unexplained by the fitted model.
– The Model SS is the difference between C. Total SS and Error SS. It represents the variability explained by the model.
Mean Square
The mean square statistics for the Model and Error sources of variation. Each Mean Square value is the sum of squares divided by its corresponding DF.
Note: The square root of the Mean Square for Error is the same as RMSE in the Summary of Fit table.
F Ratio
The model mean square divided by the error mean square. The F Ratio is the test statistic for a test of whether the model differs significantly from a model where all predicted values are the response mean. The underlying hypothesis of the fit is that all the regression parameters (except the intercept) are zero. If this hypothesis is true, then both the mean square for error and the mean square for model estimate the error variance, and their ratio has an F-distribution.
Prob > F
The observed significance probability (p-value) for the test. Small p-values are considered evidence of a regression effect.
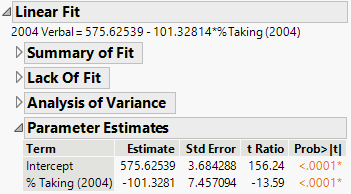
Parameter Estimates
In the Bivariate fit reports, the Parameter Estimates table contains model parameter estimates.
Figure 5.12 Parameter Estimates Table for a Linear Fit
The Parameter Estimates table contains the following columns:
Term
The model term that corresponds to the estimated parameter. The first term is the intercept.
Estimate
The parameter estimates for each term. These are the estimates of the model coefficients.
Std Error
The estimates of the standard errors of the parameter estimates.
t Ratio
The test statistics for the hypothesis that each parameter is zero. It is the ratio of the parameter estimate to its standard error. Given the usual assumptions about the model, the t Ratio has a Student’s t-distribution.
Prob>|t|
The p-value for the test that the true parameter value is zero, against the two-sided alternative that it is not.
To show additional statistics, right-click in the report and select the Columns menu. The following statistics are not shown by default:
Lower 95%
The lower 95% confidence limit for the parameter estimate.
Upper 95%
The upper 95% confidence limit for the parameter estimate.
Std Beta
The parameter estimates for a regression model where all of the terms have been standardized to a mean of 0 and a variance of 1. See Statistical Details for the Parameter Estimates Report.
VIF
The variance inflation factor (VIF) for each term in the model. High VIF values indicate a collinearity issue among the terms in the model.
Design Std Error
The square roots of the relative variances of the parameter estimates. See Statistical Details for the Parameter Estimates Report.
Fit Measured on Original Scale
In the Bivariate fit reports, the Fit Measured on Original Scale table contains numerical summaries of the model fit measured on the untransformed scale. This table is available only when the Y variable is transformed.
