Publication date: 06/27/2024
Graph Builder Examples
Interactive Data Visualization
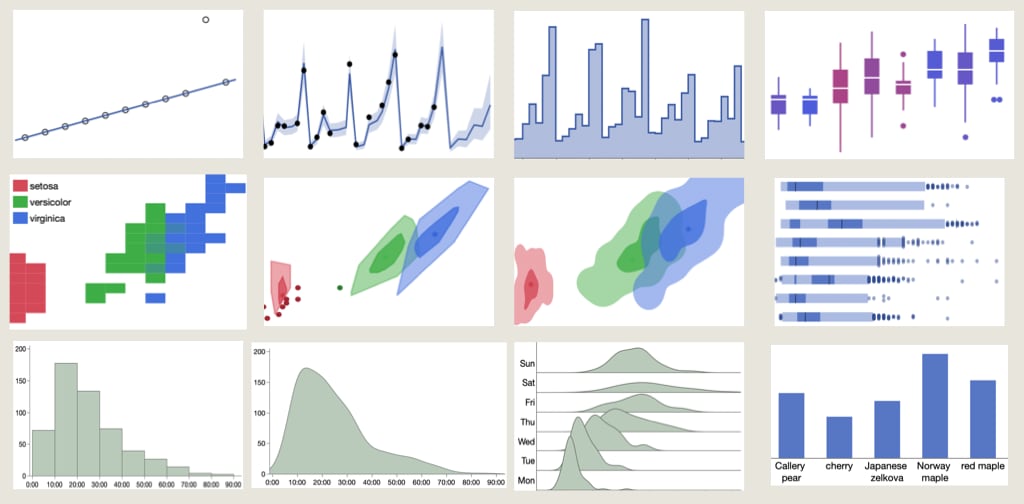
Graph Builder provides you with a variety of ways to visualize and explore your data. This chapter provides detailed examples of data exploration using bar charts, histograms, area plots, maps, and other types of plots.
Figure 4.1 Graphs Created in Graph Builder
Contents
Example of an Ordered Bar Chart
Example of an Area and Line Chart
Example of a Map Chart
Example of a Butterfly Chart
Example of a Scatterplot
Example of a Packed Bar Chart
Example of an Overlaid Histogram and Ridgeline Chart
Example of a Bullet Bar Chart
Example of a Forecast Plot
Want more information? Have questions? Get answers in the JMP User Community (community.jmp.com).
