Profiler
In the Fit Least Squares report, the Profiler option shows prediction traces for each X variable. For more information about the profiler, see Profiler in Profilers.
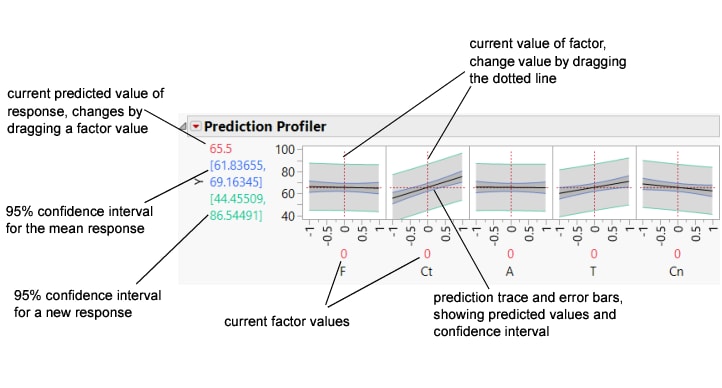
Figure 3.32 illustrates part of the profiler for the Reactor.jmp sample data table. The vertical dotted line for each X variable shows its current value or current setting. Use the Profiler to change one variable at a time in order to examine the effect on the predicted response.
Figure 3.32 Illustration of Prediction Traces
The factors F and Ct in Figure 3.32 are continuous. If the factor is nominal, the levels are displayed on the horizontal axis.
For each X variable, the value above the factor name is its current value. You change the current value by clicking in the graph or by dragging the dotted line where you want the new current value to be.
• The horizontal dotted line shows the current predicted value of each Y variable for the current values of the X variables.
• The black lines within the plots show how the predicted value changes when you change the current value of an individual X variable. The 95% confidence interval for the predicted values is shown by a dotted curve surrounding the prediction trace (for continuous variables) or an error bar (for categorical variables).
