Style Preferences for JMP Graphs and Reports
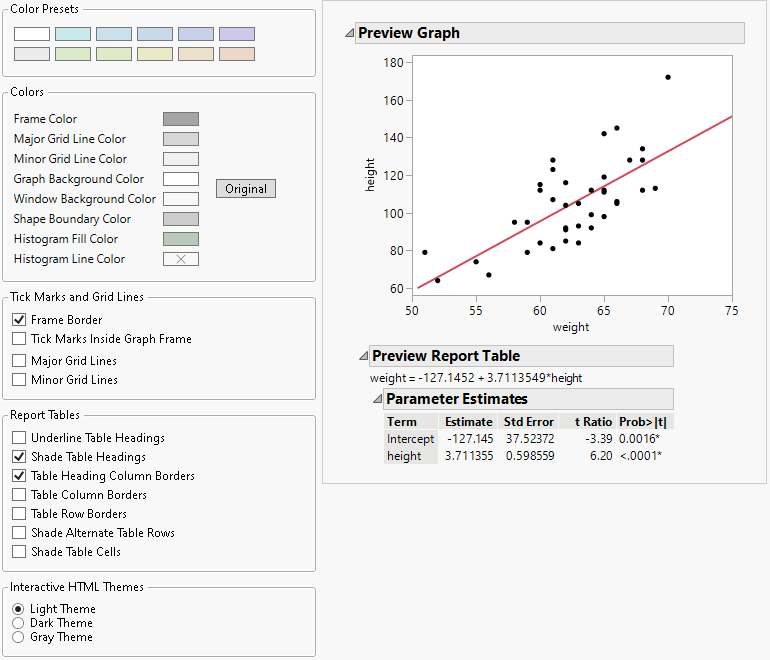
The Styles page enables you to customize colors, tick marks, grid lines, and report tables.
See Preferences for Data Tables for more information about configuring the appearance of graphs.
Figure 15.4 Styles Preferences
Preference | Description |
|---|---|
Color Presets | The Color Presets provides a set of predefined colors for use in customizing the appearance of reports, graphs, charts, and so on Tints of the selected color are applied to the various elements. Note: The selected color is applied also to windows. |
Frame Color | Defines the color applied to a graph frame and tick marks. Click to change the default color. |
Major Grid Line Color | Defines the major grid line color. Click to change the default color. |
Minor Grid Line Color | Defines the minor grid line color. Click to change the default color. |
Graph Background Color | Click the color box to select a background color for all graphs. Click to change the default color. |
Window Background Color | Click the color box to select a background color for all reports and data tables. Click to change the default color. |
Shape Boundary Color | Click the color box to select the color for shape files boundaries. |
Histogram Fill Color | Defines the color to fill the histogram. Click to change the default color. |
Histogram Line Color | Defines the histogram line color. Click to change the default color. |
Original | Click to restore default color settings. |
Frame Border | Shows borders only on the axes. This option is selected by default. |
Tick Marks Inside Graph Frame | Shows axis tick marks inside the graph frame. This option is deselected by default. |
Major Grid Lines | Shows major grid lines on graphs. This option is deselected by default. |
Minor Grid Lines | Shows minor grid lines on graphs. This option is deselected by default. |
Underline Table Headings | Shows border under table headings. This option is deselected by default. |
Shade Table Headings | Shows table headings with shading. This option is selected by default. |
Table Heading Column Borders | Shows divider lines between columns in table headings. This option is selected by default. |
Table Column Borders | Shows borders between table columns. This option is deselected by default. |
Table Row Borders | Shows borders between table rows. This option is deselected by default. |
Shade Alternate Table Rows | Shows alternate table rows with shading. This option is deselected by default. |
Shade Table Cells | Shows table cells with shading. This option is deselected by default. |
Interactive HTML Themes | Specifies the color theme for interactive HTML pages. The default theme is Light Theme. |
