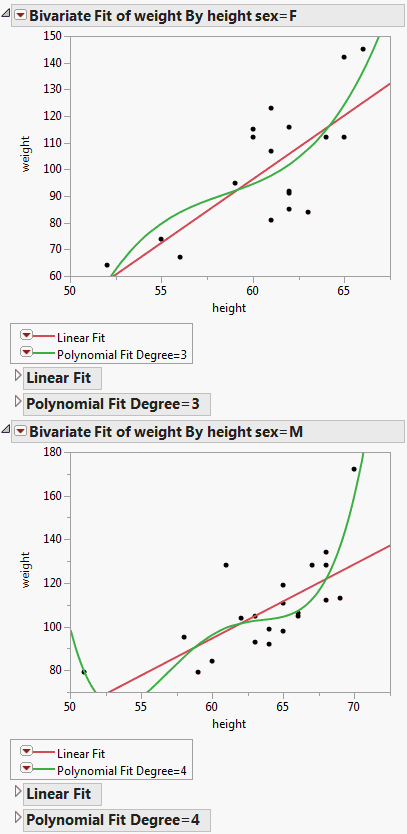
In many JMP platforms, you can specify columns as By variables. To do this in a script, include a By argument in the platform command, listing each column as an argument.
The following example uses the Big Class.jmp data table, which contains the names, ages, sex, heights, and weights for 40 students. Create a bivariate report of weight by height, using sex as a By variable, and adding a variety of fits.
|
1.
|
biv = dt << Bivariate( Y( weight ), X( height ), By( sex ));
The first line opens the Big Class.jmp sample data table. The second line creates a platform object called biv that runs a bivariate report of weight and height by sex.
|
3.
|
|
1.
|
Show( biv );
|
3.
|
In the log, rather than returning a single reference to a platform, Bivariate[], the platform object returns a list of references: biv = {Bivariate[], Bivariate[]}. The two references correspond to the two levels (F and M) of the By variable, sex.
biv << Fit Line;
|
5.
|
|
7.
|
|
8.
|
|
9.
|
If you specify more than one column in By argument, graphs appear for each subgroup of each By variable. In this example, By( sex, age ) would produce graphs for females age 12, females age 13, and so on, up to age 17. It would also produce graphs for males age 12 up to age 17.
The following example shows how to launch a platform with By groups and extract results (in this case, variances) from each group:
onew = dt << Oneway( x( :age ), y( :height ), by( :sex ), anova );
r = onew << Report;
nBy = N Items( r );
For( i = 1, i <= nBy, i++,
Show( vc );
Summarize( byValues = By( :sex ) );
New Table( "Variances" )
width( 8 ),
 .
.
