Risk Based Monitoring
Risk-based monitoring is a proactive method of clinical trial monitoring to detect patient safety risks and data quality issues at an early stage of a trial. Unlike traditional monitoring methods which often involve 100% Source Data Verification (SDV), which is costly and time consuming, risk-based monitoring uses a targeted approach to allocate monitoring resources based on specific risks identified at the study site, country, monitor, or vendor level.
The Risk-Based Monitoring (RBM) report makes use of the clinical trial database and allows users to supplement this data with two additional files.
The first file is a site-level supplemental data set that captures information about the study site, including the geographic parameters of each site, the date when each site became active, monitor and vendor names or IDs, and then group sites in different categories. If monitor and vendor-level information is provided, then RBM will provide risk indicators at the monitor and vendor level, as well. Refer to Site Details for Risk Based Monitoring Report for more information.
The second supplemental data set was modeled after the CDISC event domain, and uses the two-letter prefix RB. This file can contain data that was not captured through the eCRFs at either subject or site-level. For example: the number of completed or missing eCRF pages, number of queries, number of eligibility or protocol violations identified by the biostatistics team, number of discrepancies in drug dispensation compared to the Interactive Voice Response System (IVRS) logs, the number of missing regulatory documents that are to be maintained at the site etc. If this file is prepared, risk indicators will be calculated for all the variables in this file.
These are the individual risk indicators that JMP Clinical is calculating when supporting data is available:
|
Category |
Risk Indicator Name |
Risk Indicator Label | Risk Indicator Description |
|---|---|---|---|
| Enrollment | TOTAL | Total Subjects | Number of unique subjects identified, should equal randomized plus screen failures |
| RAND | Randomized | Number of randomized subjects | |
| SCRNFAIL | Screen Failure | Number of screen failures | |
| PCTSCRNFAIL | Percent Screen Fail of Total Subjects | Percent screen failures of total subjects | |
| TREATED | Treated | Number of treated subjects | |
| PATWEEKS | PatientWeeks on Study | Sum of the weeks subjects have been in the study | |
| MISSCONSENT | Missing Informed Consent | Number of subjects without Informed Consent | |
| WEEKSACTIVE | Weeks Active | How long site has been active. Computed from Site Active Date and maximum available date from Subject Visits (SV) or Findings domains. Remaining enrollment metrics are dependent on Site Active Date being supplied | |
| SITERATE | Randomized per Week Active | Average number of randomized subjects per week | |
| EXPRAND | Expected Randomized | Number of randomized subjects expected based on the total randomized and sum of Weeks Active across all sites | |
| DIFFRAND | Observed Minus Expected Randomized | Randomized per Week Active minus Expected Randomized. Negative or positive numbers show under- or overperformance, respectively | |
| TARGETRAND | Target Randomized | Based on target rate supplied from the dialog | |
| TARGETDIFFRAND | Observed Minus Target Randomized | Randomized per Week Active minus Target Randomized. Negative or positive numbers show under- or overperformance from target, respectively | |
| Disposition | COMPLETED | Completed | Number of subjects completing the trial |
| PCTCOMPLETED | Percent Completed of Randomized Subjects | Percent Completed of randomized subjects | |
| ONGOING | Ongoing | Randomized minus Completed minus Discontinued | |
| PCTONGOING | Percent Ongoing of Randomized Subjects | Percent Ongoing of randomized subjects | |
| DISCONT | Discontinued | Number of subjects that discontinued the trial early | |
| PCTDISCONT | Percent Discontinued of Randomized Subjects | Percent Discontinued of randomized subjects | |
| DISCONTDEATH | Discontinued due to Death | Number of subjects discontinuing due to death | |
| DISCONTAE | Discontinued due to AE | Number of subjects discontinuing due to AE | |
| DISCONTLTFU | Lost to Followup | Number of subjects lost to follow-up | |
| WITHDREW | Patient Withdrew from Study | Number of subjects that withdrew consent | |
| DISCONTOTH | Discontinued Other | Number of subjects discontinuing not captured by other reasons | |
| TOTIE | Total Inclusion or Exclusion Not Met | Number of inclusion exclusion criteria not met experienced by randomized subjects | |
| AVGIE | Average Inclusion or Exclusion Not Met per Randomized Subject | Number of inclusion exclusion criteria not met experienced by randomized subjects / Number of randomized subjects | |
| TOTDV | Total Protocol Deviations | Number of protocol deviations experienced by randomized subjects | |
| AVGDV | Average Deviations per Randomized Subject | Number of protocol deviations experienced by randomized subjects / Number of randomized subjects | |
| Safety | DEATH | Death | Number of subjects that died |
| PCTDEATH | Percent Deaths of Randomized Subjects | Percent Deaths of randomized subjects | |
| PWDEATH | Deaths per PatientWeek | Number of subjects that died / PatientWeeks on Study | |
| TOTAE | Total AEs on Study | Number of AEs experienced by randomized subjects | |
| AVGAE | Average AEs per Randomized Subject | Number of AEs experienced by randomized subjects / Number of randomized subjects | |
| PWAE | AEs per PatientWeek | Number of AEs experienced by randomized subjects / PatientWeeks on Study | |
| TOTSAE | Total SAEs on Study | Number of SAEs experienced by randomized subjects | |
| AVGSAE | Average SAEs per Randomized Subject | Number of SAEs experienced by randomized subjects / Number of randomized subjects | |
| PWSAE | SAEs per PatientWeek | Number of SAEs experienced by randomized subjects / PatientWeeks on Study | |
| TOTHO | Total Healthcare Encounters on Study | Number of Healthcare Encounters experienced by randomized subjects | |
| AVGHO | Average Healthcare Encounters per Randomized Subject | Number of Healthcare Encounters experienced by randomized subjects / Number of randomized subjects | |
| PWHO | Healthcare Encounters per PatientWeek | Number of Healthcare Encounters experienced by randomized subjects / PatientWeeks on Study |
If supplemental data (RB) is available, then risk indicators for the supplemental ones will be calculated as well. Here is an example of possible supplemental risk indicators:
|
Category |
Risk Indicator Name |
Risk Indicator Label | Risk Indicator Description |
|---|---|---|---|
| Supplemental | CRFPAGE | CRF Page | Number of CRF pages |
| AVGCRFPAGE | CRF Page per Randomized Subject | Number of CRF pages / Number of randomized subjects | |
| PWCRFPAGE | CRF Page per PatientWeek | Number of CRF pages / PatientWeeks on Study | |
| OCRFPAGE | Overdue CRF Page | Number of overdue CRF pages (no RBENDTC) | |
| AVGOCRFPAGE | Overdue CRF Page per Randomized Subject | Number of overdue CRF pages / Number of randomized subject | |
| PWOCRFPAGE | Overdue CRF Page per PatientWeek | Number of overdue CRF pages / PatientWeek on Study | |
| RCRFPAGE | Average CRF Response Time | The average CRF entry response time. Units are unimportant, but should be consistent for all sites; Days are used and it is calculated from RBSTDTC and RBENDTC | |
| QUERY | Query | Number of queries | |
| AVGQUERY | Query per Randomized Subject | Number of queries / Number of randomized subjects | |
| PWQUERY | Query per PatientWeek | Number of queries / PatientWeeks on Study | |
| OQUERY | Overdue Query | Number of overdue queries (no RBENDTC) | |
| AVGOQUERY | Overdue Query per Randomized Subject | Number of overdue queries / Number of randomized subjects | |
| PWOQUERY | Overdue Query per PatientWeek | Number of overdue queries / PatientWeeks on Study | |
| RQUERY | Average Query Response Time | The average query response time. Units are unimportant, but should be consistent for all sites; Days are used and it is calculated from RBSTDTC and RBENDTC | |
| PROTDEV | Protocol Deviation | Number of protocol deviation | |
| AVGPROTDEV | Protocol Deviation per Randomized Subject | Number of protocol deviations / Number of randomized subjects | |
| PWPROTDEV | Protocol Deviation per PatientWeek | Number of protocol deviations / PatientWeeks on Study | |
| SITEDEV | Site Deviation | Number of site deviations | |
| AVGSITEDEV | Site Deviation per Randomized Subject | Number of site deviations / Number of randomized subjects | |
| PWSITEDEV | Site Deviation per PatientWeek | Number of site deviations / PatientWeeks on Study | |
| ELIGIBILITY | Eligibility Violation | Number of eligibility violations | |
| AVGELIGIBILITY | Eligibility Violation per Randomized Subject | Number of eligibility violations / Number of randomized subjects | |
| PWELIGIBILITY | Eligibility Violation per PatientWeek | Number of eligibility violations / PatientWeeks on Study |
Beside individual risk indicators, overall indicators are calculated by taking the weighted averages of the individual risk indicators, centered and scaled so that no single variable will overwhelm the statistic. JMP Clinical provides five overall risk indicators to assess either the overall site/country/monitor/vendor performance by averaging all variables for which risk thresholds are defined (those columns with green, yellow, and red color), or the performance for each category: Enrollment, Disposition, Safety, and Supplemental.
|
Category |
Risk Indicator Name |
Risk Indicator Label |
|---|---|---|
| Overall | OVERALL | Overall Risk Indicator |
| OVERALLE | Overall Risk Indicator Enrollment | |
| OVERALLD | Overall Risk Indicator Disposition | |
| OVERALLS | Overall Risk Indicator Safety | |
| OVERALLX | Overall Risk Indicator Supplemental |
In order to run the Risk Based Monitoring report a third external file is needed that defines the risk thresholds. JMP Clinical ships with the Default Risk Threshold data set (shown below) so that you can begin performing your RBM analysis as soon as possible, and to assist with developing your own risk threshold data sets.
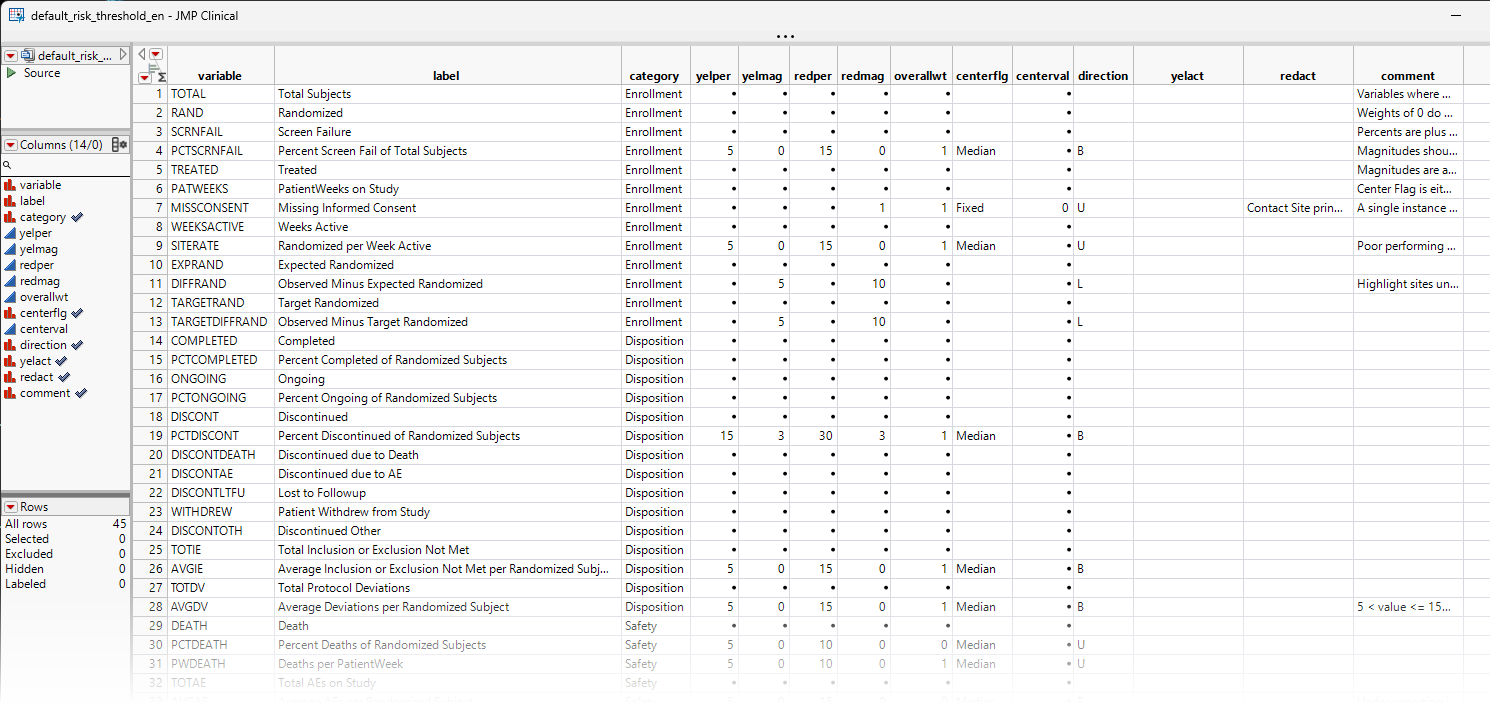
Note: You should refer to How does JMP Clinical define various terms for risk-based monitoring? for information about how terms used in risk-based monitoring are defined.
Report Results Description
Running Risk Based Monitoring with the default options for the Nicardipine study generates the Results shown below. By default risk-indicators are calculated at site, country, and subject levels . A heat map and a bar chart are provided for both site and country level. Associated data tables are also provided.
The Report contains the following elements:
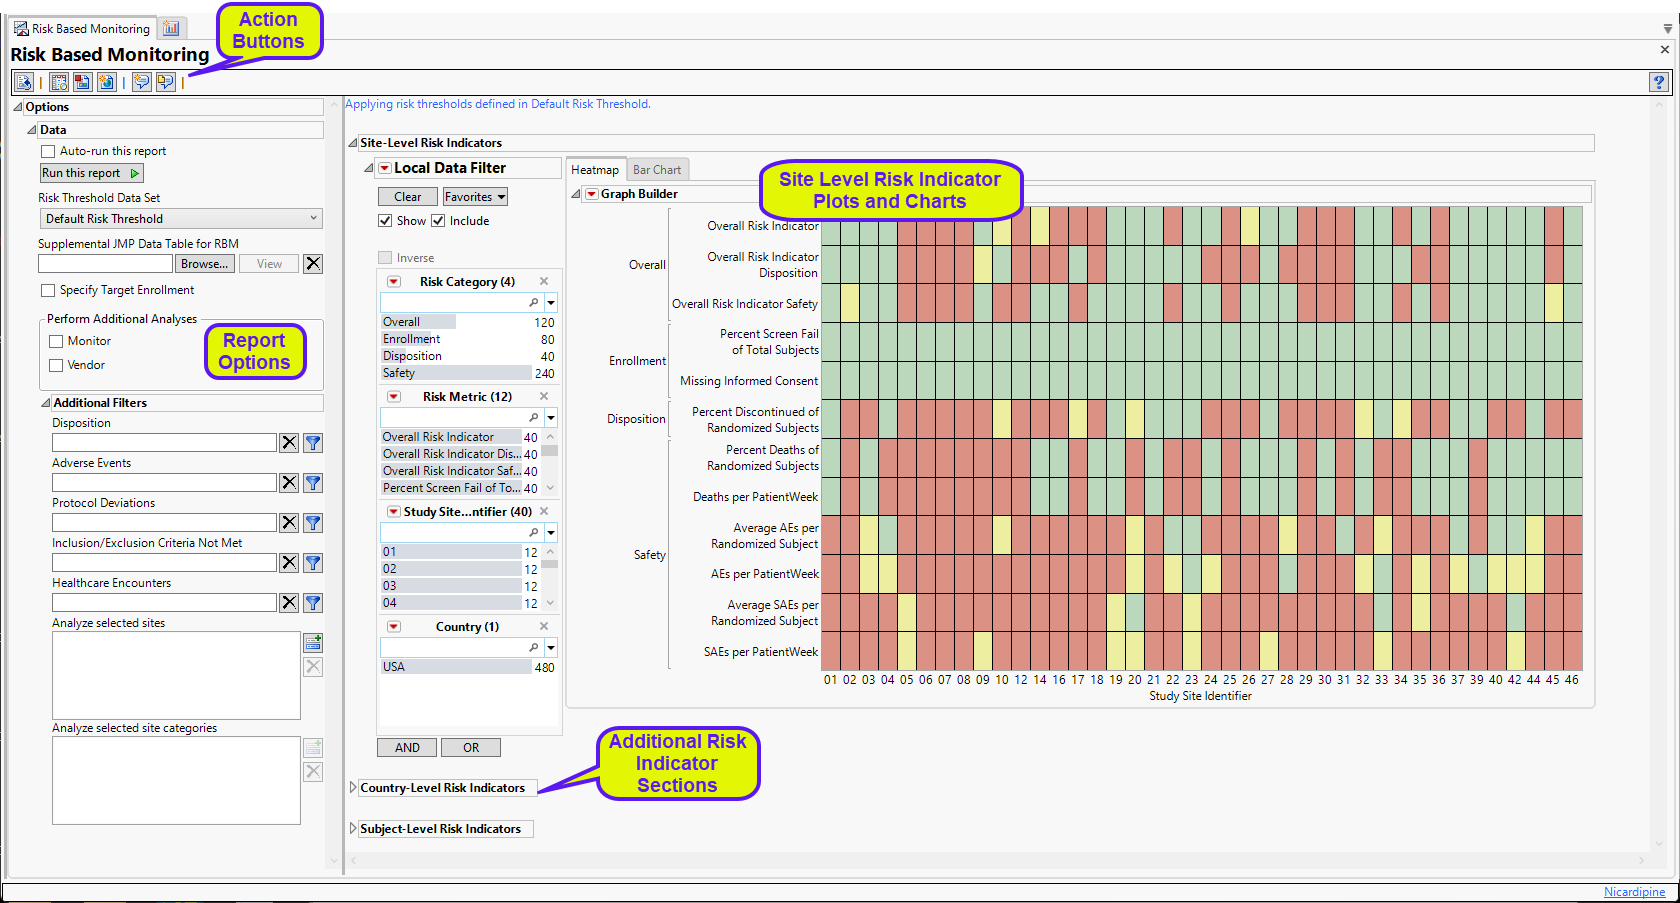
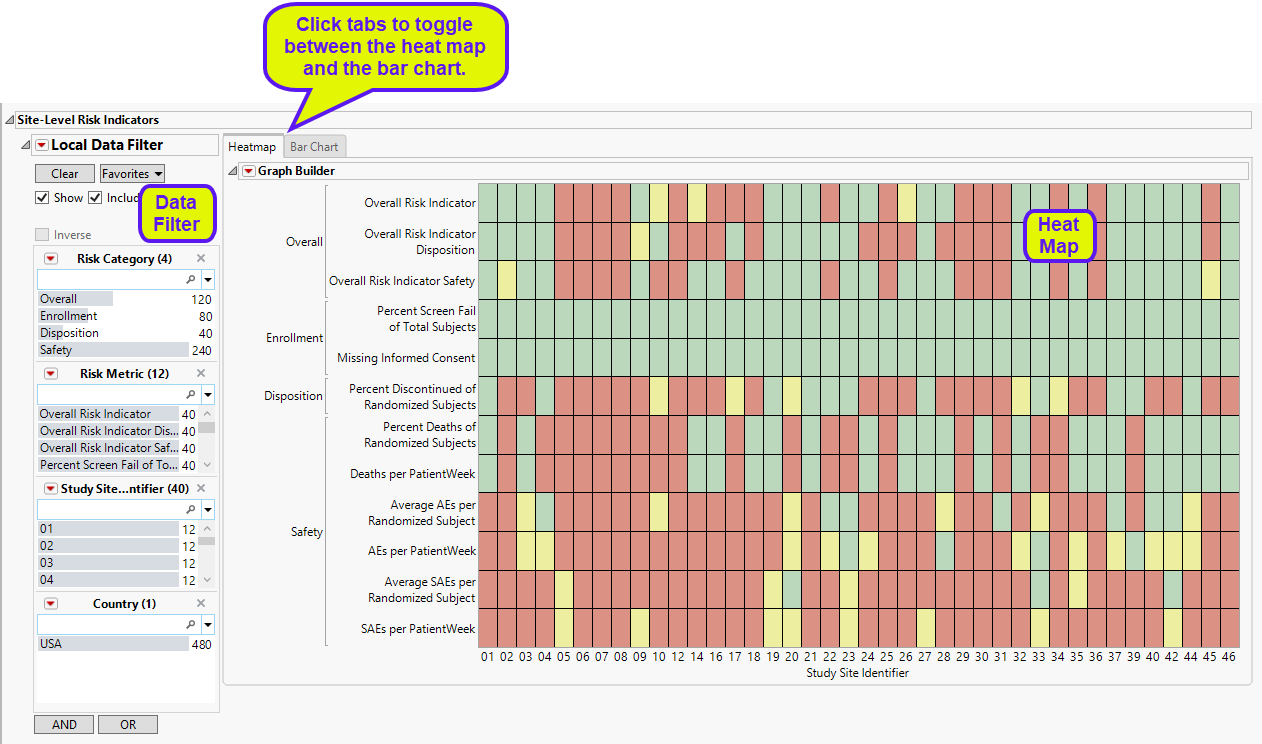
Site-Level Risk Indicators
The Site-Level Risk Indicators section contains the following elements:
| • | A heat map of the various risk indicators by Site Identifiers. Individual blocks are colored by the relative severity of each indicator at that site: red = severe, yellow = moderate, green = mild or none. This section enables you to view the distribution of risk indicators across sites, possibly identifying any outliers. |
| • | A Local Data Filter to filter to data of interest, for example, to risk indicators that belong to a particular site. |
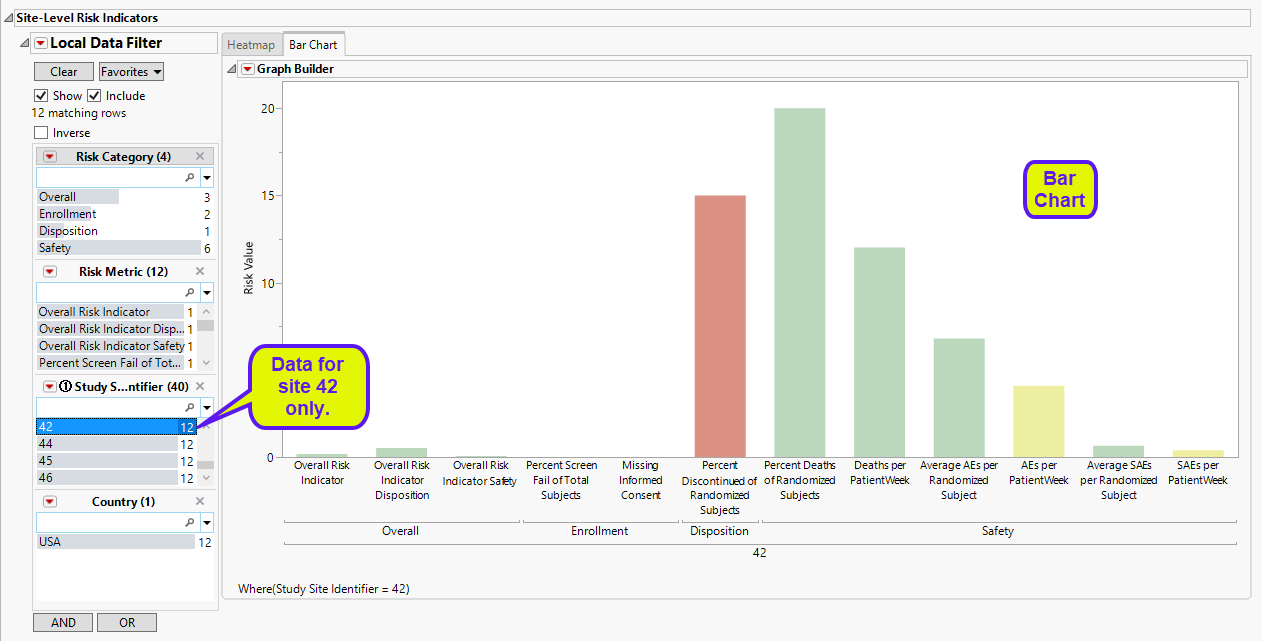
| • | A bar chart showing the risk value for each indicator across the sites. The data in the following bar chart were filtered to site 42 only. |
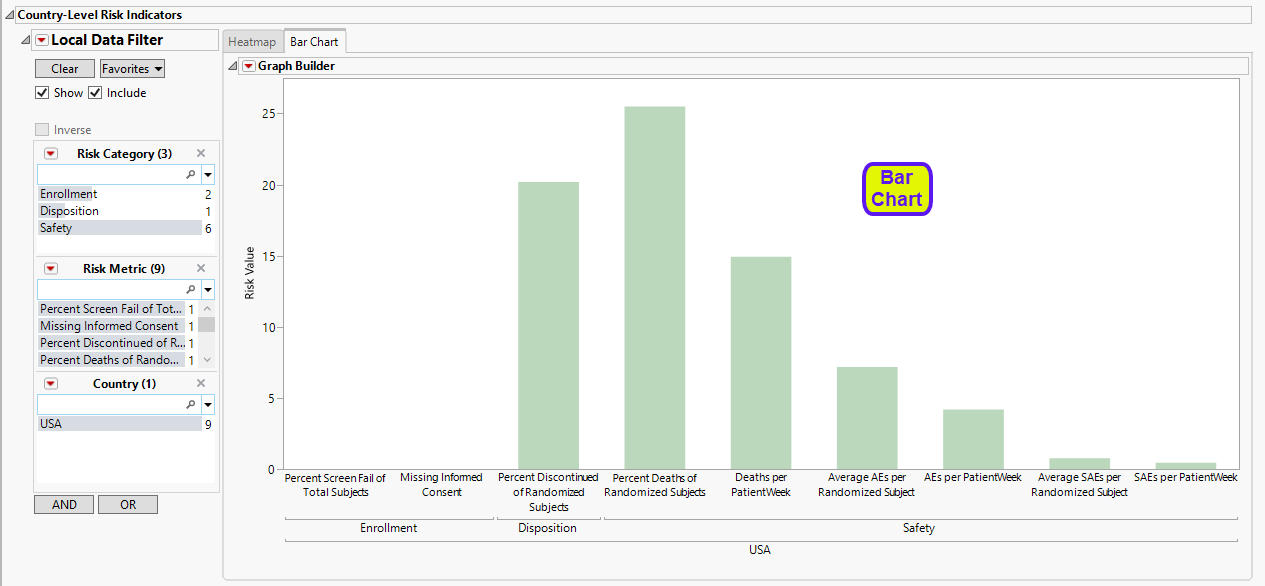
Country-Level Risk Indicators
The Country-Level Risk Indicators section contains the following elements:
| • | A heat map of the various risk indicators by Country Identifiers. Individual blocks are colored by the relative severity of each indicator at that site: red = severe, yellow = moderate, green = mild or none. This section enables you to view the distribution of risk indicators across countries, possibly identifying any outliers. |
| • | Note: All of the trial sites are located within the United States, so only one country is displayed. |
| • | A Local Data Filter to filter to data of interest, for example, to risk indicators that belong to certain risk categories. |
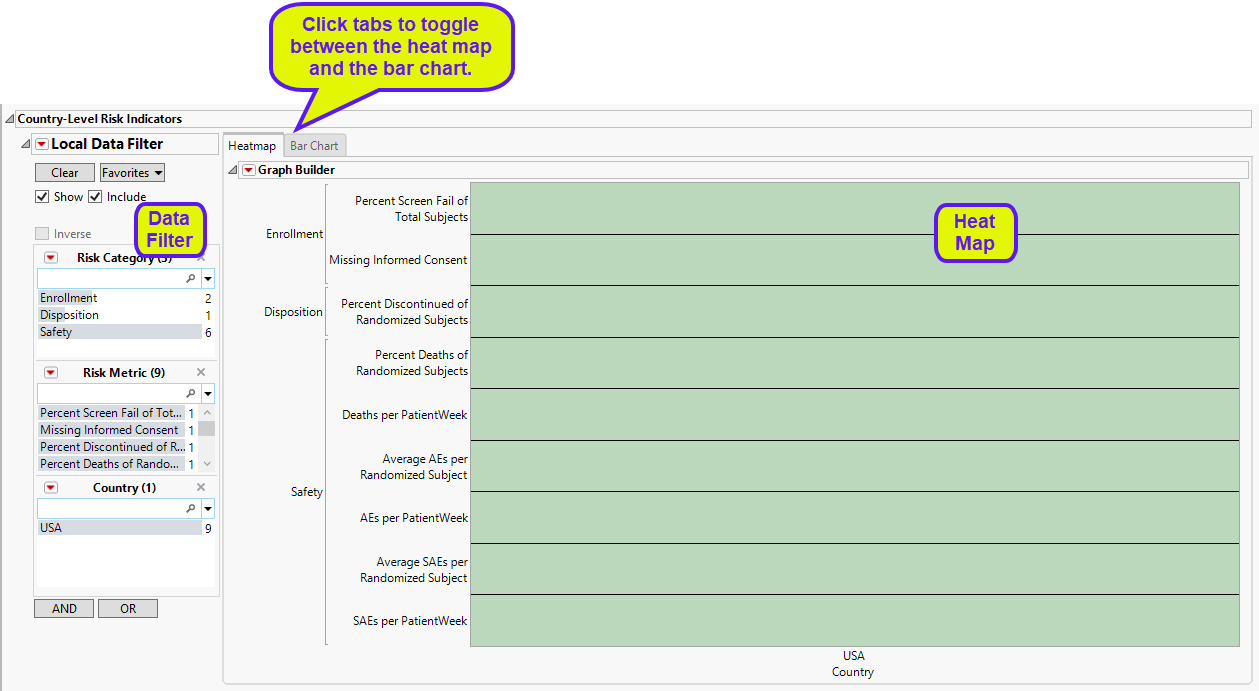
| • | A bar chart showing the risk value for each indicator. across the sites. |
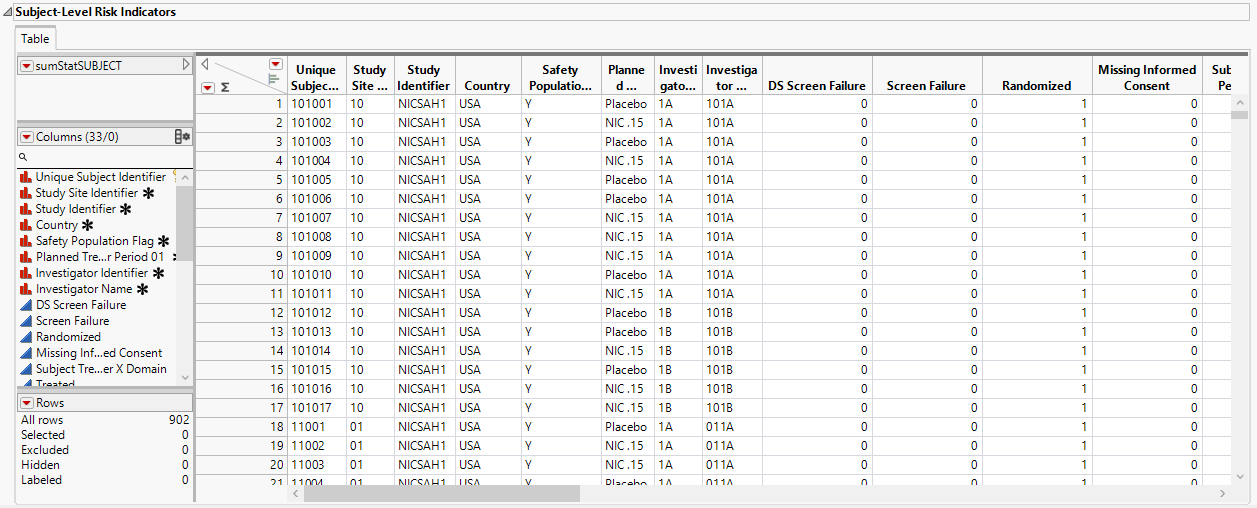
Subject-Level Risk Indicators
The Subject-Level Risk Indicators section contains the following elements:
| • | A table listing the risk indicators of each subject. |
Output Data
You can view the output data tables by clicking on the  action button. The data tables display risk indicators derived using the study database as well as data included in the optional supplemental data set. Two data tables are generated for each level except subject-level. The two tables at each level contain the same information, but they are organized differently.
| • | Site-Level Risk Indicators: This data table displays risk indicators summarized at the site level. Risk indicators with defined thresholds are colored in green, yellow, or red. Each site-level risk indicator is in a separate column. This is a "short" and "wide" data table. |
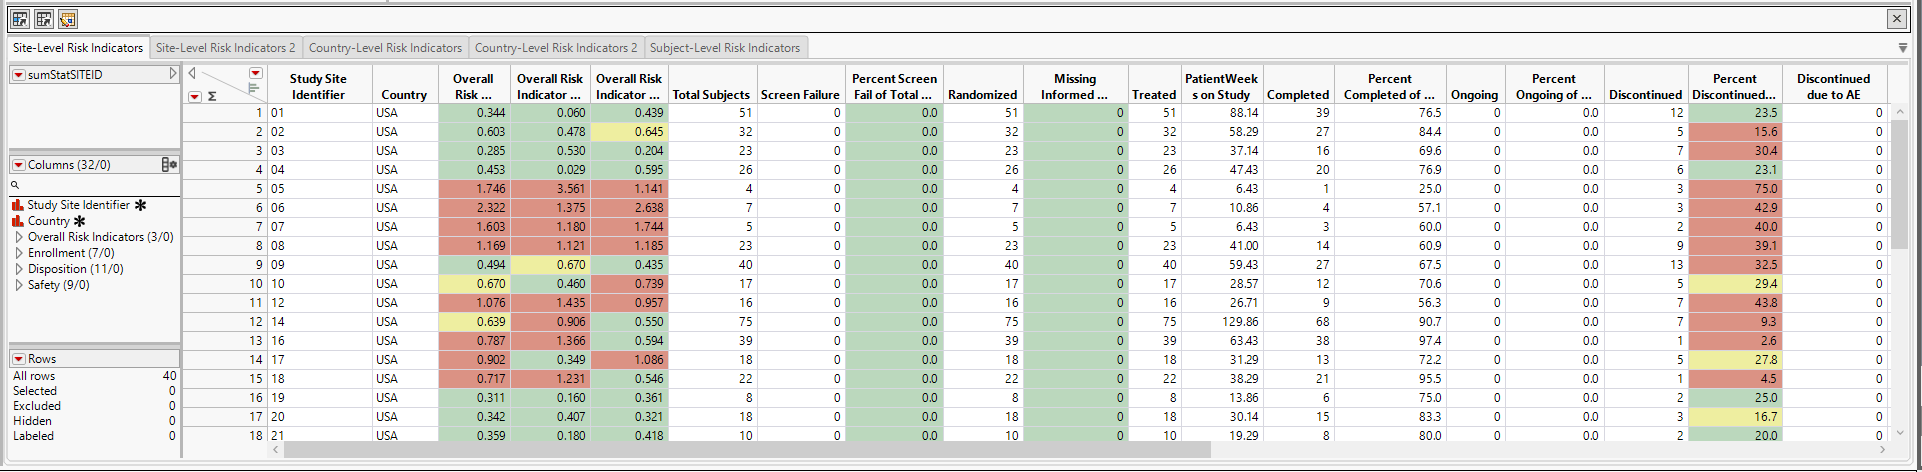
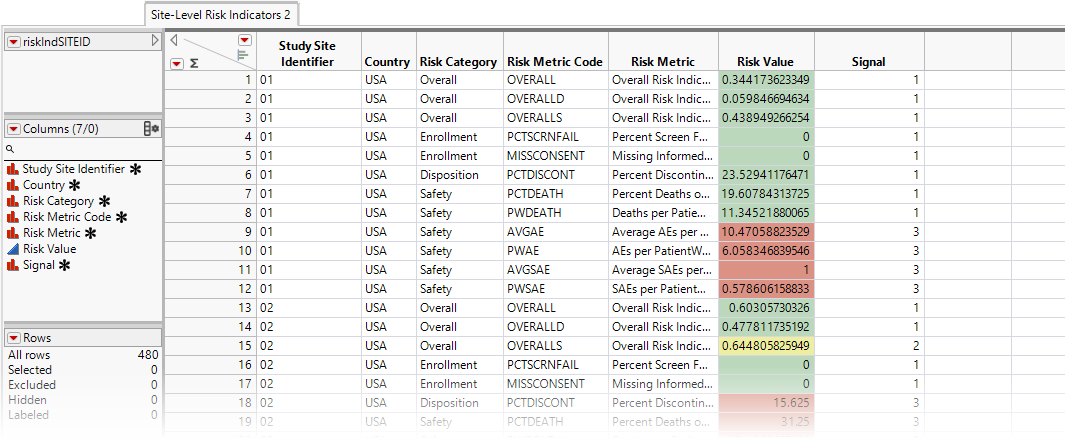
| • | Site-Level Risk Indicators 2: This data table displays risk indicators summarized at the site level. It contains only those risk indicators that have a defined threshold and they are colored in green, yellow, or red. All the risk values are stacked in the same column: Risk Value. The risk indicator name is stored in the Risk Metric column. This is a "long" and "narrow" data table. |
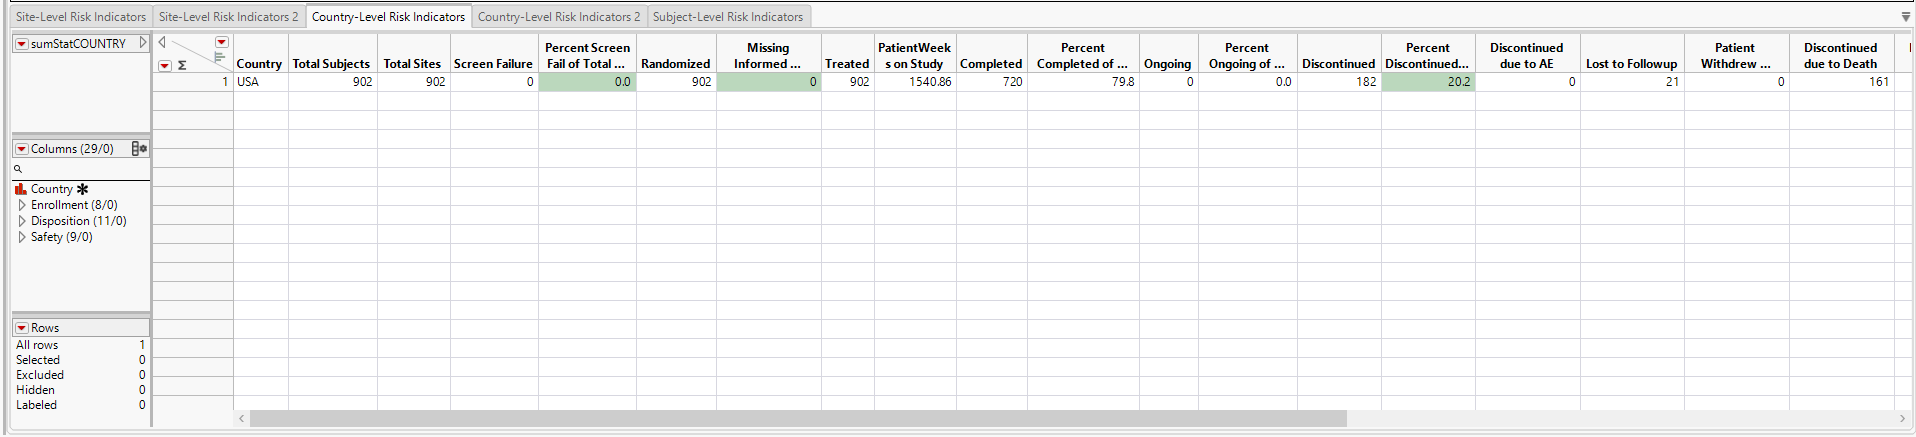
| • | Country-Level Risk Indicators: This data table displays risk indicators summarized at the country level. Risk indicators with defined thresholds are colored in green, yellow, or red. Each country-level risk indicator is in a separate column. This is a "short" and "wide" data table. |
| • | Country-Level Risk Indicators 2: This data table displays risk indicators summarized at the country level. It contains only those risk indicators that have a defined threshold and they are colored in green, yellow, or red. All the risk values are stacked in the same column: Risk Value. The risk indicator name is stored in the Risk Metric column. This is a "long" and "narrow" data table. |
| • | Subject-Level Risk Indicators |
This is the same table displayed in the Subject-Level Risk Indicators section above.
Note: If monitor and vendor information is provided through the site-level supplemental data, then graphs and data tables at monitor and vendor level will be provided as well.
Options
Data
Use the options on this panel to customize your analysis.
Auto run this report
Check this box to auto run this report upon opening using specified study preferences
Risk Threshold Data Set
The risk threshold data set is used as a reference to identify and label levels of risk in the Study. Use the drop down menu to select the risk threshold data set to use in the analysis. Refer to Risk Threshold Data TableSet for more information about risk threshold data sets.
Supplemental JMP Data Table for RBM
Use this option to specify a data set containing supplemental data to include in the RBM analysis. Refer to Supplemental JMP Data Table for RBM for more information
Specify Target Enrollment
Check Specify Target Enrollment box to specify a target enrollment rate.
Target Enrollment of Subjects per Week per Site
Specify the number of subjects enrolled per week per site. Refer to Target Enrollment of Subjects per Week per Site for more information. Note: This option is available only when the Specify Target Enrollment box is checked.
Monitor
Check the Monitor box to perform additional analyses at the monitor level.
Vendor
Check the Vendor box to perform additional analyses at the vendor level.
Additional Filters
Disposition
This option enables you to use construct a filter for selecting a subpopulation of the study based on their meeting specified Disposition criteria. Risk indicators will be calculated using this subset of dispositions only. Refer to Disposition for more information.
Adverse Events
This option enables you to use construct a filter for selecting a subpopulation of the study based on their meeting specified Adverse Event criteria. Risk indicators will be calculated using this subset of adverse events only. Refer to Adverse Events for more information.
Protocol Deviations
The Protocol Deviations field is an optional parameter that enables you to filter rows from the DV data set to choose the appropriate records to deviations of interest. Risk indicators will be calculated using this subset of deviations only. Refer to Protocol Deviations for more information.
Inclusion/Exclusion Criteria Not Met
The Inclusion/Exclusion Criteria Not Met field is an optional parameter that enables you to filter rows from the IE data set to choose the appropriate records to subset to failed inclusion or exclusion criteria of interest. Risk indicators are calculated using this subset of inclusion or exclusion criteria only. Refer to Inclusion/Exclusion Criteria Not Met for more information.
Healthcare Encounters
The Healthcare Encounters field is an optional parameter that enables you to filter rows from the HO data set to choose the appropriate records to subset to health-care encounters of interest. Risk indicators are then calculated using this subset of health-care encounters only. Refer to Healthcare Encounters for more information.
Analyze selected sites
The Analyze Selected Sites option enables you to limit the analysis to a selected subset of study sites. Risk indicators are then calculated for those sites only.
Analyze selected site categories
The Analyze selected site categories option enables you to limit the analysis to a selected subset of site categories that are specified in Site Details for Risk Based Monitoring Report.
General and Drill Down Buttons
Action buttons, provide you with an easy way to drill down into your data. The following action buttons are generated by this report:
| • | Click  to reset all report options to default settings. to reset all report options to default settings. |
| • | Click  to view the associated data tables. Refer to Show Tables/View Data for more information. to view the associated data tables. Refer to Show Tables/View Data for more information. |
| • | Click  to generate a standardized pdf- or rtf-formatted report containing the plots and charts of selected sections. to generate a standardized pdf- or rtf-formatted report containing the plots and charts of selected sections. |
| • | Click  to generate a JMP Live report. Refer to Create Live Report for more information. to generate a JMP Live report. Refer to Create Live Report for more information. |
| • | Click  to take notes, and store them in a central location. Refer to Add Notes for more information. to take notes, and store them in a central location. Refer to Add Notes for more information. |
| • | Click  to read user-generated notes. Refer to View Notes for more information. to read user-generated notes. Refer to View Notes for more information. |
Methodology
No statistical testing is performed. Moderate and severe risk are defined as described below:
When percentages are specified, risk is defined as:
| • | moderate (yellow), when the  with with  . . |
| • | severe (red), when  with with  . . |
where  is the mean, median or user-supplied center value, and xij is the value of the ith site (or country, vendor, monitor) for the jth risk indicator. The quantity cij = |xij - mij|, (xij - mij, or -(xij - mij) for Direction equal to B (both), U (upper), or L (lower), respectively.
When percentages are not specified, risk is defined as:
| • | moderate (yellow), when  . . |
| • | severe (red), when  . . |
Overall risk indicators are calculated as  , where
  ,
,  , or
, or  for Direction equal to B (both), U (upper), or L (lower), respectively.The wj are weights for the overall risk indicator; 1 by default.
Refer to How are risk thresholds defined? for more information.