Preferences for JMP Graphs
Graph preferences customize the appearance of graphs. See Preferences for Data Tables for more information about configuring the appearance of graphs.
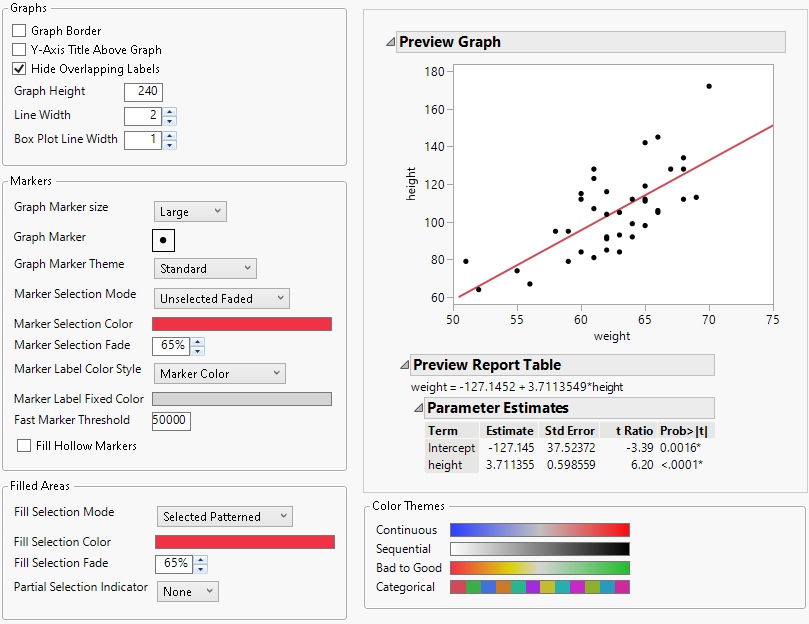
Figure 15.3 Graphs Preferences
Preference | Description |
|---|---|
Graph Border | Draws a border line around the area of the graph. This option is deselected by default. |
Y-Axis Title Above Graph | Shows the Title for the Y-Axis above the line rather than beside the line. This option is deselected by default. |
Hide Overlapping Labels | Select this option to hide overlapping chart labels. This option is selected by default. |
Graph Height | Sets the default height (in pixels) for a graph. The default setting is 240 pixels. Some platforms take the value and multiply it by a certain amount. Note: With Graph Builder windows, specifying the Graph Height enlarges the window proportionally, but the exact value is not applied. |
Line Width | Sets the default width (in pixels) for lines that pertain to content. The default setting is two pixels. Note: This preference does not apply to grid lines. |
Box Plot Line Width | Sets the default line width for box plots across platforms. |
Graph Marker Size | Select a default size for the markers in graphs: Dot, Small, Medium, Large, XL, XXL, or XXXL. This preference is applied when the marker size is set to Preferred on a graph. The default setting is Large. When the number of markers in a graph exceeds the Fast Marker Threshold, the graph’s Marker Drawing Mode is set to Fast. which draws dot-sized markers. |
Graph Marker | Select a default marker shape for the markers in graphs. The default setting is a small dot. |
Graph Marker Theme | Select a default theme for the markers in graphs when you mark by row or column. The default setting is Standard. |
Marker Selection Mode | Select the default formatting for selected markers. The default setting is Unselected Faded. See Change the Selection Mode of Markers. |
Marker Selection Color | When the Marker Selection Mode is Selected Same Color, this setting applies the specified color to selected markers. The default color is Red. |
Marker Selection Fade | When the Marker Selection Mode is Unselected Faded, this setting fades the unselected markers by the specified amount (in percent). The default setting is 65%. |
Marker Label Color Style | Select the color of the marker label that appears on a graph when you label a column in the data table. Marker Color The marker label is the same color as the marker. This option is selected by default. Marker Color Faded The marker label is faded according to the Marker Selection Fade preference. Fixed Color The marker label color is as specified. The Marker Label Fixed Color preference determines the color. |
Marker Label Fixed Color | Select the color of fixed-color marker labels, an option that you select in the Marker Label Color Style preference. The default color is gray. |
Fast Marker Threshold | When JMP refreshes a report window, it can draw markers or points on a plot at two different speeds: normal and fast. If JMP is in normal drawing mode, and the number of markers on a graph are more than the specified threshold number, JMP automatically switches to fast mode. Enter the number of markers that separate normal and fast mode. When the number of markers in a graph exceeds the Fast Marker Threshold, the graph's Marker Drawing Mode is set to Fast. which draws dot-sized markers. The default setting is 50,000. |
Fill Hollow Markers | Select this option to apply an opaque background to markers. This option is deselected by default. |
Fill Selection Mode | Select the default highlight for selected rows in graphic objects: Selected Patterned A striped pattern (default) Selected Darkened A solid darker color Selected Outlined An outline Selected Same Color The Fill Selection Color in the preferences formats the selected object. Unselected Faded Unselected rows are faded, and selected rows are the original color. |
Fill Selection Color | Select the default color of selected rows in graphic objects when the Fill Selection Mode is “Selected Same Color”. The default color is red. |
Fill Selection Fade | This setting fades the unselected markers by the specified amount (in percent). The default setting is 65%. |
Partial Selection Indicator | Select the indicator for a partial selection. The available options are None, Bar, Pie, or Waffle. The default setting is None. |
Continuous Color Theme | Select a default color theme for continuous data. The default theme is Blue to Gray to Red. See Create Color Themes in Graphs. |
Sequential Color Theme | Select the default color theme for sequential data that do not have a meaningful midpoint. The default theme is White to Black. |
Bad to Good Color Theme | Select the default color theme for diverging data that ranges from positive to negative data. The default theme is Stoplight Bad to Good. |
Categorical Color Theme | Select a default color theme for categorical data. The default theme is JMP Default. See Create Color Themes in Graphs. |
